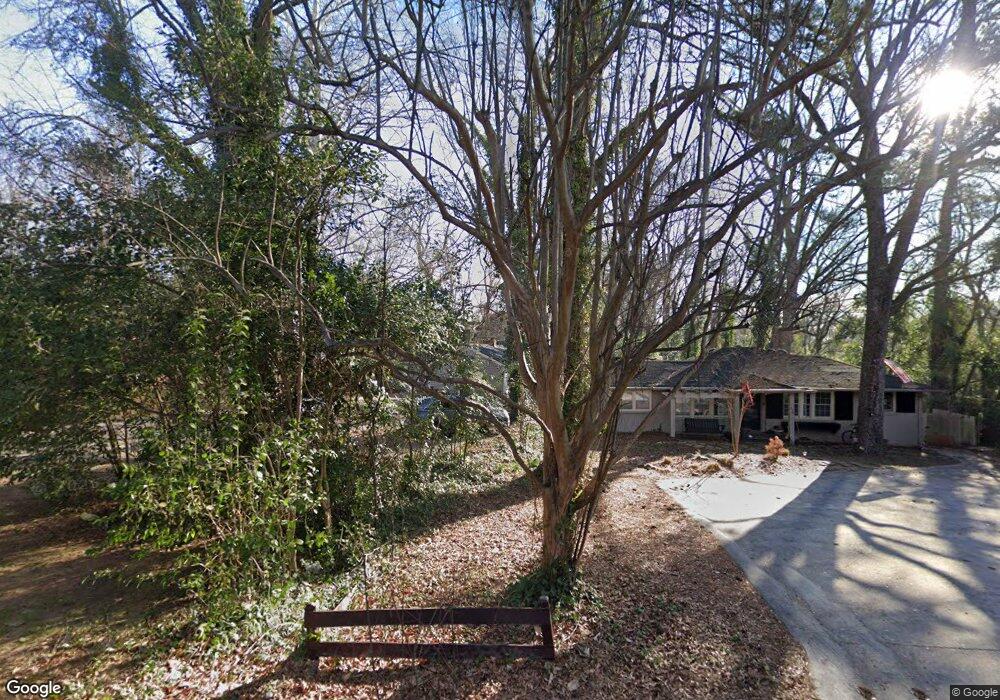
1631 S Milledge Ave Athens, GA 30605
Five Points NeighborhoodEstimated Value: $671,000 - $693,000
4
Beds
2
Baths
2,215
Sq Ft
$307/Sq Ft
Est. Value
About This Home
This home is located at 1631 S Milledge Ave, Athens, GA 30605 and is currently estimated at $679,622, approximately $306 per square foot. 1631 S Milledge Ave is a home located in Clarke County with nearby schools including Barrow Elementary School, Clarke Middle School, and Clarke Central High School.
Ownership History
Date
Name
Owned For
Owner Type
Purchase Details
Closed on
Mar 20, 2014
Sold by
Ballew Steven A
Bought by
Flat Rock Properties Llc
Current Estimated Value
Purchase Details
Closed on
Dec 30, 2013
Sold by
Byers Grady L
Bought by
Ballew Steven A
Purchase Details
Closed on
May 5, 2008
Sold by
Griffith Daniel Lee
Bought by
Byers Grady L and Ballew Steven A
Home Financials for this Owner
Home Financials are based on the most recent Mortgage that was taken out on this home.
Original Mortgage
$195,500
Interest Rate
5.86%
Mortgage Type
New Conventional
Purchase Details
Closed on
Sep 10, 2004
Sold by
Griffith George Sanders
Bought by
Griffith Daniel Lee
Purchase Details
Closed on
Mar 1, 2000
Sold by
Chapala Investment Trust The B
Bought by
Griffith George Sanders
Purchase Details
Closed on
Jul 30, 1999
Sold by
Cook Anne C
Bought by
Chapala Investment Trust The By Co-
Create a Home Valuation Report for This Property
The Home Valuation Report is an in-depth analysis detailing your home's value as well as a comparison with similar homes in the area
Home Values in the Area
Average Home Value in this Area
Purchase History
| Date | Buyer | Sale Price | Title Company |
|---|---|---|---|
| Flat Rock Properties Llc | -- | -- | |
| Ballew Steven A | -- | -- | |
| Byers Grady L | $230,000 | -- | |
| Griffith Daniel Lee | $200,000 | -- | |
| Griffith George Sanders | $188,000 | -- | |
| Chapala Investment Trust The By Co- | $140,000 | -- |
Source: Public Records
Mortgage History
| Date | Status | Borrower | Loan Amount |
|---|---|---|---|
| Previous Owner | Byers Grady L | $195,500 |
Source: Public Records
Tax History Compared to Growth
Tax History
| Year | Tax Paid | Tax Assessment Tax Assessment Total Assessment is a certain percentage of the fair market value that is determined by local assessors to be the total taxable value of land and additions on the property. | Land | Improvement |
|---|---|---|---|---|
| 2025 | $7,160 | $230,599 | $51,000 | $179,599 |
| 2024 | $7,160 | $211,852 | $51,000 | $160,852 |
| 2023 | $5,938 | $177,125 | $51,000 | $126,125 |
| 2022 | $4,748 | $148,853 | $37,400 | $111,453 |
| 2021 | $4,112 | $122,023 | $37,400 | $84,623 |
| 2020 | $3,927 | $116,540 | $34,000 | $82,540 |
| 2019 | $3,753 | $110,551 | $34,000 | $76,551 |
| 2018 | $3,629 | $106,906 | $34,000 | $72,906 |
| 2017 | $3,055 | $89,981 | $34,000 | $55,981 |
| 2016 | $3,126 | $92,064 | $34,000 | $58,064 |
| 2015 | $3,015 | $88,664 | $30,600 | $58,064 |
| 2014 | $3,044 | $89,390 | $30,600 | $58,790 |
Source: Public Records
Map
Nearby Homes
- 183 Parkway Dr
- 1697 S Milledge Ave
- 685 Pinecrest Dr
- 490 Ofarrell St
- 221 University Dr
- 760 E Campus Rd Unit 93
- 760 E Campus Rd Unit 95
- 115 Annes Ct
- 160 Riverdale Dr
- 655 E Campus Rd Unit 12
- 204 Gran Ellen Dr
- 515 Hampton Ct
- 265 Annes Ct
- 128 Habersham Dr
- 2019 S Lumpkin St
- 275 Westview Dr
- 997 S Milledge Ave Unit 2
- 997 S Milledge Ave Unit 3
- 997 S Milledge Ave Unit 1
- 997 S Milledge Ave Unit 4
- 1637 S Milledge Ave
- 130 Southview Dr
- 180 Southview Dr
- 120 Southview Dr
- 1645 S Milledge Ave
- 1646 S Milledge Ave
- 198 Southview Dr
- 1655 S Milledge Ave
- 18 Milledge Ct
- 1620 S Milledge Ave
- 1650 S Milledge Ave
- 240 Southview Dr
- 20 Milledge Ct
- 14 Milledge Ct
- 145 Parkway Dr
- 10 & 12 Milledge Ct
- 250 Southview Dr
- 105 Southview Dr
- 115 Southview Dr
- 175 Southview Dr