16310 Hosmer Rd Middlefield, OH 44062
Estimated Value: $163,000 - $197,000
3
Beds
1
Bath
1,340
Sq Ft
$133/Sq Ft
Est. Value
About This Home
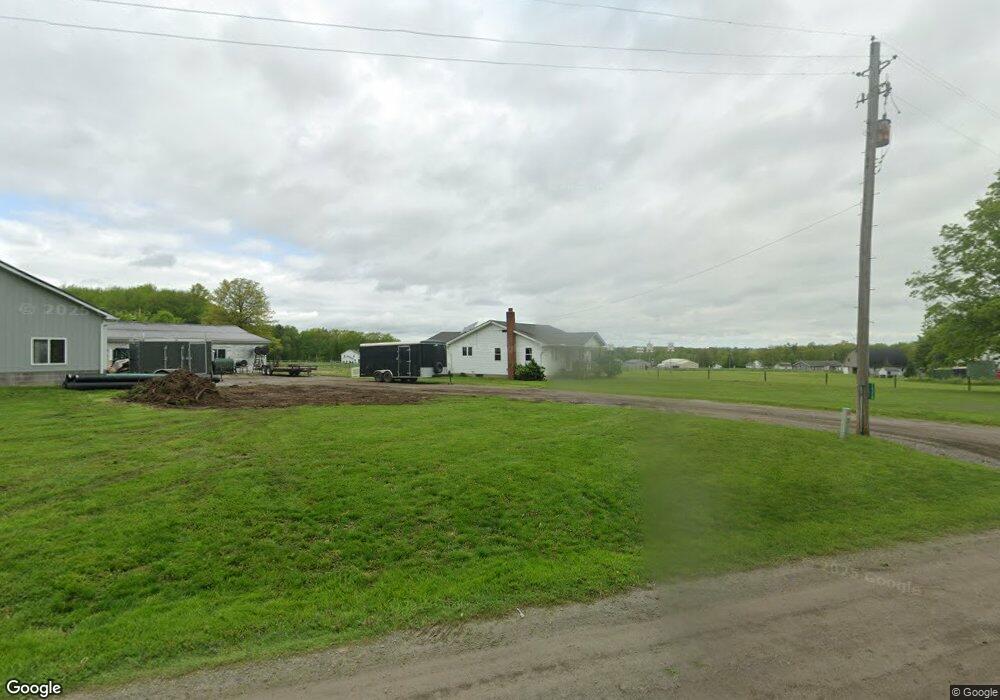
This home is located at 16310 Hosmer Rd, Middlefield, OH 44062 and is currently estimated at $177,722, approximately $132 per square foot. 16310 Hosmer Rd is a home located in Geauga County with nearby schools including Jordak Elementary School, Cardinal Middle School, and Cardinal High School.
Ownership History
Date
Name
Owned For
Owner Type
Purchase Details
Closed on
May 21, 2016
Sold by
Johnson Daniel C and Johnson Kathryn R
Bought by
Weaver Pete H and Weaver Emma H
Current Estimated Value
Home Financials for this Owner
Home Financials are based on the most recent Mortgage that was taken out on this home.
Original Mortgage
$60,000
Outstanding Balance
$47,888
Interest Rate
3.74%
Mortgage Type
Adjustable Rate Mortgage/ARM
Estimated Equity
$129,834
Purchase Details
Closed on
Oct 31, 1994
Sold by
Atwood Morrell R
Bought by
Weaver William P
Home Financials for this Owner
Home Financials are based on the most recent Mortgage that was taken out on this home.
Original Mortgage
$91,000
Interest Rate
5.75%
Mortgage Type
New Conventional
Purchase Details
Closed on
Jan 1, 1990
Bought by
Atwood Morrell R
Create a Home Valuation Report for This Property
The Home Valuation Report is an in-depth analysis detailing your home's value as well as a comparison with similar homes in the area
Purchase History
| Date | Buyer | Sale Price | Title Company |
|---|---|---|---|
| Weaver Pete H | $75,000 | Attorney | |
| Weaver William P | $87,500 | -- | |
| Atwood Morrell R | -- | -- |
Source: Public Records
Mortgage History
| Date | Status | Borrower | Loan Amount |
|---|---|---|---|
| Open | Weaver Pete H | $60,000 | |
| Previous Owner | Weaver William P | $91,000 |
Source: Public Records
Tax History
| Year | Tax Paid | Tax Assessment Tax Assessment Total Assessment is a certain percentage of the fair market value that is determined by local assessors to be the total taxable value of land and additions on the property. | Land | Improvement |
|---|---|---|---|---|
| 2024 | $1,241 | $33,040 | $4,060 | $28,980 |
| 2023 | $1,244 | $33,040 | $4,060 | $28,980 |
| 2022 | $1,102 | $23,700 | $3,400 | $20,300 |
| 2021 | $1,099 | $23,700 | $3,400 | $20,300 |
| 2020 | $1,135 | $23,700 | $3,400 | $20,300 |
| 2019 | $108 | $20,900 | $3,400 | $17,500 |
| 2018 | $1,083 | $20,900 | $3,400 | $17,500 |
| 2017 | $1,083 | $20,900 | $3,400 | $17,500 |
| 2016 | $1,201 | $26,220 | $3,400 | $22,820 |
| 2015 | $766 | $26,220 | $3,400 | $22,820 |
| 2014 | $725 | $26,220 | $3,400 | $22,820 |
| 2013 | $731 | $26,220 | $3,400 | $22,820 |
Source: Public Records
Map
Nearby Homes
- 16310 Madison Rd
- 15791 Madison Rd
- 16765 Old State Rd
- 16510 Bundysburg Rd
- 15868 Kenwood Dr
- 15229 Timber Ridge Dr
- 15243 Woodsong Dr
- 14706 Steeplechase Dr
- 16008 Button St
- 16298 Weathervane Dr
- 15142 Sawgrass Ln
- 15143 Woodsong Dr
- 15100 Timber Ridge Dr
- 8070 Parkman Mesopotamia Rd
- V/L High Pointe Cir
- 15648 Elmwood St
- 17808 Nash Rd
- 15720 Jug Rd
- 229 2nd St
- 12977 Main Market Rd
- 16282 Hosmer Rd
- 16330 Hosmer Rd
- 16339 Hosmer Rd
- 16236 Old State Rd
- 16342 Hosmer Rd
- 16275 Old State Rd
- 16255 Old State Rd
- 16241 Old State Rd
- 16231 Old State Rd
- 16229 Old State Rd
- 16704 Shedd Rd
- 16405 Hosmer Rd
- 16376 Hosmer Rd
- 16394 Hosmer Rd
- 16199 Old State Rd
- 16227 Old State Rd
- 16720 Shedd Rd
- 16727 Shedd Rd
- 16425 Hosmer Rd
- 16158 Old State Rd
Your Personal Tour Guide
Ask me questions while you tour the home.