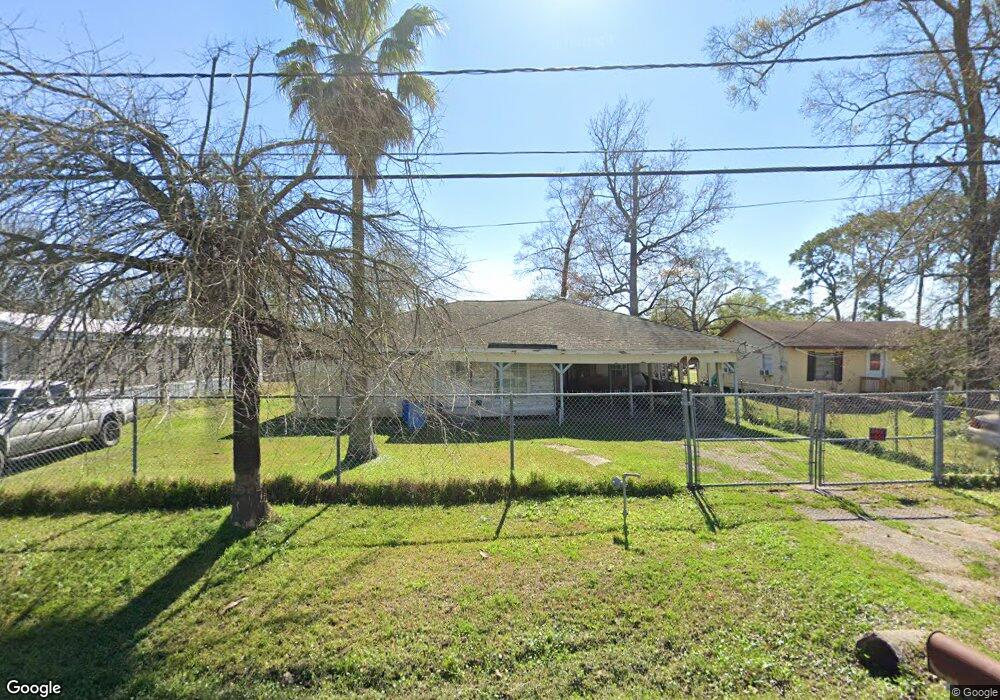
16312 Pecan St Channelview, TX 77530
Estimated Value: $167,000 - $223,000
3
Beds
2
Baths
1,390
Sq Ft
$140/Sq Ft
Est. Value
About This Home
This home is located at 16312 Pecan St, Channelview, TX 77530 and is currently estimated at $194,689, approximately $140 per square foot. 16312 Pecan St is a home located in Harris County with nearby schools including Channelview High School and Family Christian Academy.
Ownership History
Date
Name
Owned For
Owner Type
Purchase Details
Closed on
Oct 20, 2009
Sold by
Mares Jose and Mares Briaseida
Bought by
Villanueva Nancy
Current Estimated Value
Purchase Details
Closed on
Apr 24, 1993
Sold by
Barrington Aubrey H and Barrington Frances M
Bought by
Mares Jose and Mares Briaseida
Home Financials for this Owner
Home Financials are based on the most recent Mortgage that was taken out on this home.
Original Mortgage
$38,000
Interest Rate
9%
Mortgage Type
Seller Take Back
Create a Home Valuation Report for This Property
The Home Valuation Report is an in-depth analysis detailing your home's value as well as a comparison with similar homes in the area
Home Values in the Area
Average Home Value in this Area
Purchase History
| Date | Buyer | Sale Price | Title Company |
|---|---|---|---|
| Villanueva Nancy | -- | None Available | |
| Mares Jose | $38,000 | -- | |
| Mares Jose | $38,000 | -- |
Source: Public Records
Mortgage History
| Date | Status | Borrower | Loan Amount |
|---|---|---|---|
| Previous Owner | Mares Jose | $38,000 |
Source: Public Records
Tax History Compared to Growth
Tax History
| Year | Tax Paid | Tax Assessment Tax Assessment Total Assessment is a certain percentage of the fair market value that is determined by local assessors to be the total taxable value of land and additions on the property. | Land | Improvement |
|---|---|---|---|---|
| 2025 | $3,400 | $164,157 | $70,131 | $94,026 |
| 2024 | $3,400 | $166,755 | $70,131 | $96,624 |
| 2023 | $2,807 | $163,179 | $56,104 | $107,075 |
| 2022 | $2,964 | $127,328 | $36,467 | $90,861 |
| 2021 | $2,353 | $97,118 | $36,467 | $60,651 |
| 2020 | $2,209 | $86,006 | $30,858 | $55,148 |
| 2019 | $2,259 | $86,006 | $30,858 | $55,148 |
| 2018 | $844 | $60,433 | $10,519 | $49,914 |
| 2017 | $1,589 | $60,433 | $10,519 | $49,914 |
| 2016 | $1,589 | $60,433 | $10,519 | $49,914 |
| 2015 | $1,199 | $60,433 | $10,519 | $49,914 |
| 2014 | $1,199 | $44,653 | $10,519 | $34,134 |
Source: Public Records
Map
Nearby Homes
- 812 Coolidge St
- 431 Crockett St
- 16516 Market St
- 16534 Market St
- 16305 De Zavalla Rd
- 108 Cedar Ln
- 908 Lakeside Dr
- 16809 Market St
- 523 Sheldon Rd
- 16032 1/2 Ridlon St
- 16023 Ridlon St
- 822 Woodhue St
- 818 Mccardell St
- 702 Norell St
- 16134 Palm St
- 16931 Avenue B
- 0 Laurelwood Dr Unit 43034610
- 714 Horncastle St
- 15603 N Brentwood St
- 1109 Becker St