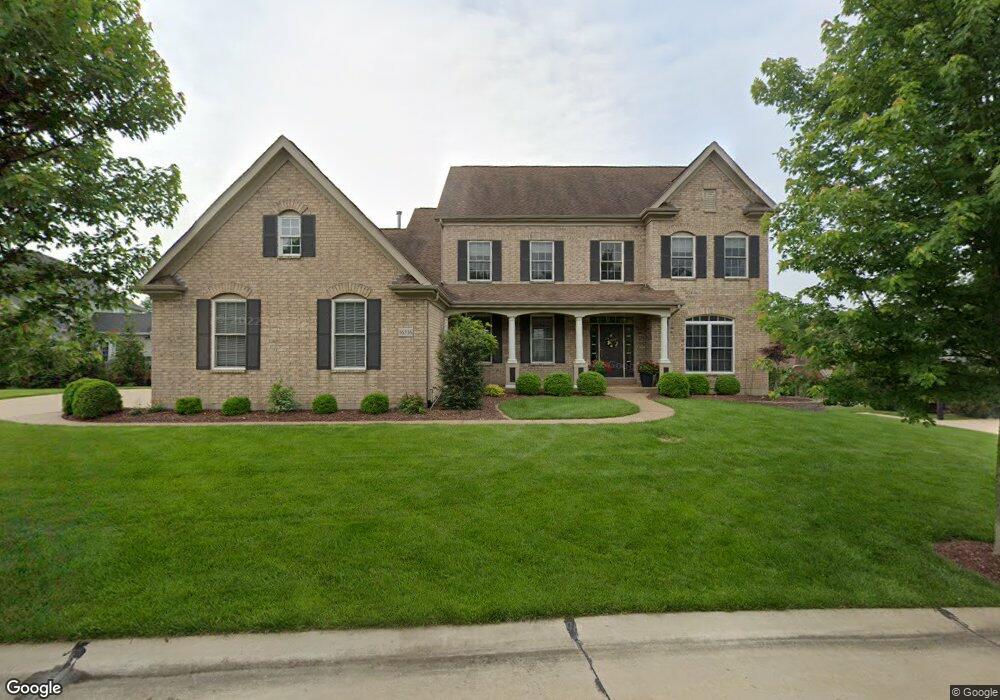
16316 Wynncrest Falls Way Chesterfield, MO 63005
Estimated Value: $954,452 - $1,109,000
4
Beds
4
Baths
3,784
Sq Ft
$266/Sq Ft
Est. Value
About This Home
This home is located at 16316 Wynncrest Falls Way, Chesterfield, MO 63005 and is currently estimated at $1,006,363, approximately $265 per square foot. 16316 Wynncrest Falls Way is a home located in St. Louis County with nearby schools including Ellisville Elementary School, Crestview Middle School, and Lafayette High School.
Ownership History
Date
Name
Owned For
Owner Type
Purchase Details
Closed on
Feb 26, 2013
Sold by
Haynes Brian W and Haynes Pamela A
Bought by
Haynes Brian W and Haynes Pamela A
Current Estimated Value
Purchase Details
Closed on
Aug 3, 2012
Sold by
Czarnecki Mark R and Czarnecki Diane M
Bought by
Haynes Brian W and Haynes Pamela A
Home Financials for this Owner
Home Financials are based on the most recent Mortgage that was taken out on this home.
Original Mortgage
$417,000
Outstanding Balance
$272,518
Interest Rate
2.5%
Mortgage Type
Adjustable Rate Mortgage/ARM
Estimated Equity
$733,845
Purchase Details
Closed on
Oct 25, 2007
Sold by
Levinson Building & Realty Corp
Bought by
Wynncrest Inc
Home Financials for this Owner
Home Financials are based on the most recent Mortgage that was taken out on this home.
Original Mortgage
$552,223
Interest Rate
6.32%
Mortgage Type
Construction
Create a Home Valuation Report for This Property
The Home Valuation Report is an in-depth analysis detailing your home's value as well as a comparison with similar homes in the area
Home Values in the Area
Average Home Value in this Area
Purchase History
| Date | Buyer | Sale Price | Title Company |
|---|---|---|---|
| Haynes Brian W | -- | None Available | |
| Haynes Brian W | $530,000 | Investors Title Co Clayton | |
| Wynncrest Inc | -- | Fa |
Source: Public Records
Mortgage History
| Date | Status | Borrower | Loan Amount |
|---|---|---|---|
| Open | Haynes Brian W | $417,000 | |
| Previous Owner | Wynncrest Inc | $552,223 |
Source: Public Records
Tax History Compared to Growth
Tax History
| Year | Tax Paid | Tax Assessment Tax Assessment Total Assessment is a certain percentage of the fair market value that is determined by local assessors to be the total taxable value of land and additions on the property. | Land | Improvement |
|---|---|---|---|---|
| 2025 | $9,618 | $143,380 | $32,510 | $110,870 |
| 2024 | $9,618 | $138,320 | $24,170 | $114,150 |
| 2023 | $9,610 | $138,320 | $24,170 | $114,150 |
| 2022 | $9,025 | $120,650 | $24,170 | $96,480 |
| 2021 | $8,959 | $120,650 | $24,170 | $96,480 |
| 2020 | $9,799 | $125,820 | $19,590 | $106,230 |
| 2019 | $9,838 | $125,820 | $19,590 | $106,230 |
| 2018 | $10,365 | $125,000 | $20,310 | $104,690 |
| 2017 | $10,118 | $125,000 | $20,310 | $104,690 |
| 2016 | $9,781 | $116,220 | $22,340 | $93,880 |
| 2015 | $9,582 | $116,220 | $22,340 | $93,880 |
| 2014 | $8,917 | $105,470 | $26,180 | $79,290 |
Source: Public Records
Map
Nearby Homes
- 2525 Peppermill Ridge Dr
- 2523 Pepperfield Ct
- 16404 Clayton Rd
- 1813 Wade Ct
- 1525 Clayton Woods Ct
- 2428 Powders Mill Dr
- 342 Clayton Trails Dr
- 16597 Clayton Rd
- 16620 Clayton Rd
- 220 Timber Meadow Dr
- 2167 Wildwood Meadows Ct
- 526 Prospector Ridge Dr
- 16641 Wycliffe Place Dr
- 2239 Samuel Stuart Ct
- 6 Chippenham Ln
- 2248 Ridgley Woods Dr
- 101 Strecker Rd
- 215 Hutchinson Rd
- 1 Rendina Ct
- 1517 Froesel Dr
- 16320 Wynncrest Falls Way
- 16304 Wynncrest Falls Way
- 2615 Wynncrest Falls Dr
- 16319 Wynncrest Falls Way
- 6 Wynncrest Falls Ct
- 16315 Wynncrest Falls Way
- 16303 Wynncrest Falls Way
- 16311 Wynncrest Falls Way
- 2606 Wynncrest Falls Dr
- 1 Wynncrest Falls Ct
- 16323 Wynncrest Falls Way
- 2619 Wynncrest Falls Dr
- 16307 Wynncrest Falls Way
- 5 Wynncrest Falls Ct
- 2618 Wynncrest Falls Dr
- 2623 Wynncrest Falls Dr
- 16327 Wynncrest Falls Way
- 16318 Peppermill Dr
- 16314 Peppermill Dr
- 2622 Wynncrest Falls Dr