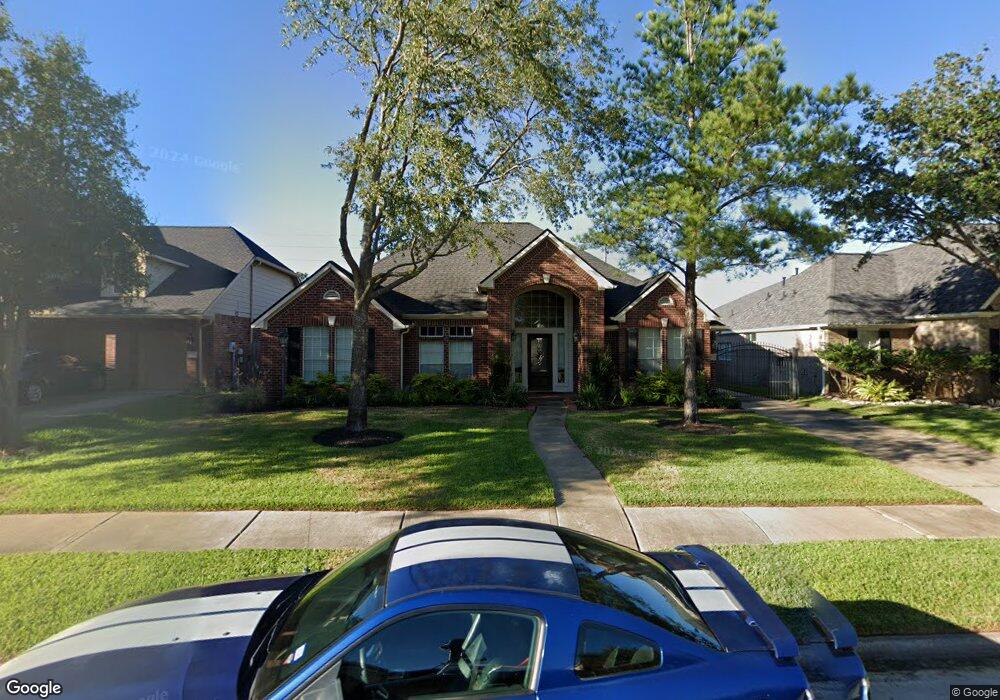
16318 Destrehan Dr Cypress, TX 77429
Estimated Value: $472,000 - $504,000
4
Beds
4
Baths
2,898
Sq Ft
$170/Sq Ft
Est. Value
About This Home
This home is located at 16318 Destrehan Dr, Cypress, TX 77429 and is currently estimated at $493,627, approximately $170 per square foot. 16318 Destrehan Dr is a home located in Harris County with nearby schools including Sampson Elementary School, Spillane Middle School, and Cypress Woods High School.
Ownership History
Date
Name
Owned For
Owner Type
Purchase Details
Closed on
Jun 20, 2016
Sold by
Fontana Christian and Fontana Darla
Bought by
Mancuso Scott M
Current Estimated Value
Home Financials for this Owner
Home Financials are based on the most recent Mortgage that was taken out on this home.
Original Mortgage
$30,750
Outstanding Balance
$13,766
Interest Rate
3.58%
Mortgage Type
Purchase Money Mortgage
Estimated Equity
$479,861
Purchase Details
Closed on
Jan 14, 2013
Sold by
Harris County
Bought by
Fontana Christian and Fontana Darla B
Purchase Details
Closed on
Jul 28, 1999
Sold by
Mhi Partnership Ltd
Bought by
Fontana Christian and Fontana Darla
Home Financials for this Owner
Home Financials are based on the most recent Mortgage that was taken out on this home.
Original Mortgage
$182,900
Interest Rate
7.63%
Create a Home Valuation Report for This Property
The Home Valuation Report is an in-depth analysis detailing your home's value as well as a comparison with similar homes in the area
Home Values in the Area
Average Home Value in this Area
Purchase History
| Date | Buyer | Sale Price | Title Company |
|---|---|---|---|
| Mancuso Scott M | -- | Star Tex Title Co | |
| Fontana Christian | -- | None Available | |
| Fontana Christian | -- | Mhi Title |
Source: Public Records
Mortgage History
| Date | Status | Borrower | Loan Amount |
|---|---|---|---|
| Open | Mancuso Scott M | $30,750 | |
| Open | Mancuso Scott M | $246,000 | |
| Previous Owner | Fontana Christian | $182,900 |
Source: Public Records
Tax History Compared to Growth
Tax History
| Year | Tax Paid | Tax Assessment Tax Assessment Total Assessment is a certain percentage of the fair market value that is determined by local assessors to be the total taxable value of land and additions on the property. | Land | Improvement |
|---|---|---|---|---|
| 2025 | $6,867 | $453,998 | $103,382 | $350,616 |
| 2024 | $6,867 | $456,928 | $94,024 | $362,904 |
| 2023 | $6,867 | $456,928 | $94,024 | $362,904 |
| 2022 | $8,553 | $409,969 | $67,287 | $342,682 |
| 2021 | $8,239 | $329,468 | $67,287 | $262,181 |
| 2020 | $7,736 | $294,769 | $49,330 | $245,439 |
| 2019 | $7,905 | $292,155 | $49,330 | $242,825 |
| 2018 | $2,981 | $290,000 | $49,330 | $240,670 |
| 2017 | $7,877 | $290,000 | $49,330 | $240,670 |
| 2016 | $7,877 | $290,000 | $49,330 | $240,670 |
| 2015 | $5,929 | $290,000 | $49,330 | $240,670 |
| 2014 | $5,929 | $265,000 | $49,330 | $215,670 |
Source: Public Records
Map
Nearby Homes
- 13703 Layton Hills Dr
- 16406 Haden Crest Ct
- 16211 Halpren Falls Ln
- 16219 Haden Crest Ct
- 14015 Falcon Heights Dr
- 14015 Halprin Creek Dr
- 16306 Bontura St
- 16322 Bontura St
- 16342 Granite Park Ct
- 13611 Monteigne Ln
- 16606 Darby House St
- 13506 Key Ridge Ln
- 15902 Mill Canyon Ct
- 16515 Dunleith Cir
- 13402 Layton Castle Ln
- 14126 Bloomingdale Manor Dr
- 13718 Sherburn Manor Dr
- 14207 Spindle Arbor Rd
- 16131 Cypress Point Dr
- 16502 Rawhide Trail
- 16322 Destrehan Dr
- 16314 Destrehan Dr
- 16310 Destrehan Dr
- 16326 Destrehan Dr
- 16319 Destrehan Dr
- 16315 Destrehan Dr
- 16306 Destrehan Dr
- 16323 Destrehan Dr
- 16311 Destrehan Dr
- 16403 Destrehan Dr
- 16302 Destrehan Dr
- 16407 Burham Park Dr
- 16411 Burham Park Dr
- 16307 Destrehan Dr
- 16306 Cretian Point Ct
- 16403 Burham Park Dr
- 16310 Cretian Point Ct
- 16303 Destrehan Dr
- 16415 Burham Park Dr
- 16327 Burham Park Dr