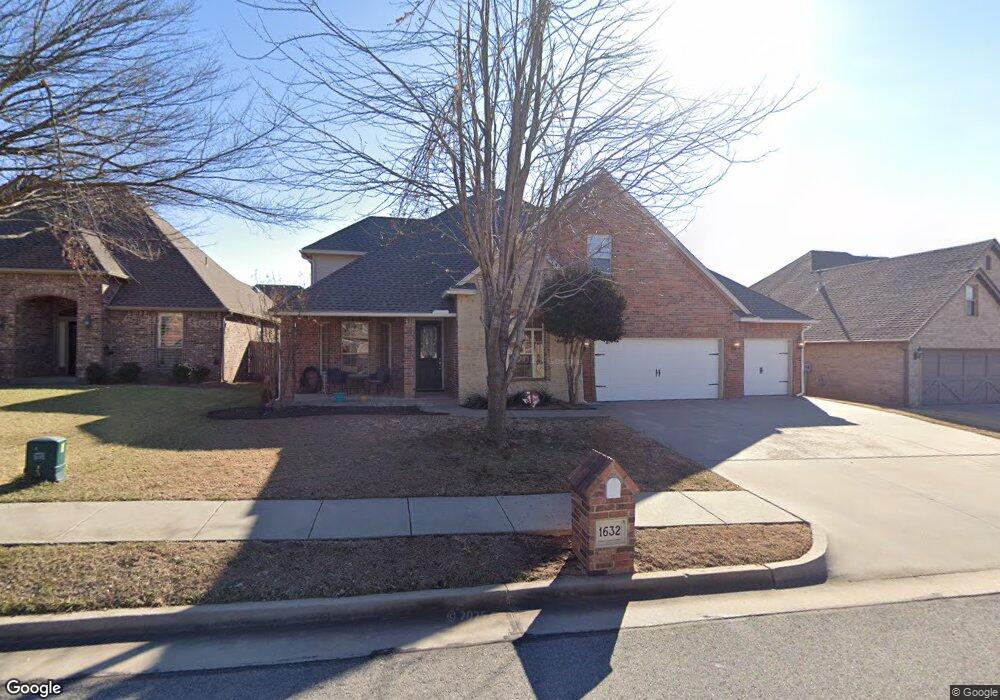
1632 Apache Trail Edmond, OK 73003
Thomas Trails NeighborhoodEstimated Value: $396,538 - $462,000
4
Beds
3
Baths
2,629
Sq Ft
$162/Sq Ft
Est. Value
About This Home
This home is located at 1632 Apache Trail, Edmond, OK 73003 and is currently estimated at $424,885, approximately $161 per square foot. 1632 Apache Trail is a home located in Oklahoma County with nearby schools including John Ross Elementary School, Cheyenne Middle School, and North High School.
Ownership History
Date
Name
Owned For
Owner Type
Purchase Details
Closed on
Oct 29, 2014
Sold by
Youngblood David L and Youngblood Jill B
Bought by
Sullivan Catherine R and Sullivan Joseph F
Current Estimated Value
Home Financials for this Owner
Home Financials are based on the most recent Mortgage that was taken out on this home.
Original Mortgage
$274,550
Outstanding Balance
$209,828
Interest Rate
4.25%
Mortgage Type
New Conventional
Estimated Equity
$215,057
Purchase Details
Closed on
Oct 18, 2006
Sold by
Precision Crafted Homes Llc
Bought by
Youngblood David L and Youngblood Jill B
Home Financials for this Owner
Home Financials are based on the most recent Mortgage that was taken out on this home.
Original Mortgage
$231,600
Interest Rate
6.37%
Mortgage Type
Purchase Money Mortgage
Purchase Details
Closed on
Aug 25, 2004
Sold by
Cheyenne Crossing Llc
Bought by
Precision Crafted Homes Llc
Create a Home Valuation Report for This Property
The Home Valuation Report is an in-depth analysis detailing your home's value as well as a comparison with similar homes in the area
Home Values in the Area
Average Home Value in this Area
Purchase History
| Date | Buyer | Sale Price | Title Company |
|---|---|---|---|
| Sullivan Catherine R | $289,000 | American Eagle Title Group | |
| Youngblood David L | -- | First American Title & Tr Co | |
| Precision Crafted Homes Llc | $33,200 | Oklahoma Title & Closing Co |
Source: Public Records
Mortgage History
| Date | Status | Borrower | Loan Amount |
|---|---|---|---|
| Open | Sullivan Catherine R | $274,550 | |
| Previous Owner | Youngblood David L | $231,600 |
Source: Public Records
Tax History
| Year | Tax Paid | Tax Assessment Tax Assessment Total Assessment is a certain percentage of the fair market value that is determined by local assessors to be the total taxable value of land and additions on the property. | Land | Improvement |
|---|---|---|---|---|
| 2025 | $3,644 | $36,769 | $4,737 | $32,032 |
| 2024 | $3,509 | $35,698 | $4,759 | $30,939 |
| 2023 | $3,509 | $34,659 | $4,877 | $29,782 |
| 2022 | $3,417 | $33,650 | $5,419 | $28,231 |
| 2021 | $3,403 | $32,670 | $6,129 | $26,541 |
| 2020 | $3,502 | $33,220 | $5,960 | $27,260 |
| 2019 | $3,425 | $32,340 | $5,960 | $26,380 |
| 2018 | $3,352 | $31,460 | $0 | $0 |
| 2017 | $3,372 | $31,789 | $5,960 | $25,829 |
| 2016 | $3,359 | $31,734 | $5,360 | $26,374 |
| 2015 | $3,297 | $31,187 | $5,360 | $25,827 |
| 2014 | $3,160 | $29,931 | $5,360 | $24,571 |
Source: Public Records
Map
Nearby Homes
- 2425 Glenmere Dr
- 1433 Glenolde Place
- 1300 Glenmere Ct
- 1801 Del Simmons Dr
- 1909 Del Simmons Dr
- 1721 Fawn Valley Ln
- 1409 Brayhill Rd
- 2112 Willow Bend Dr
- 2012 Cedar Meadow Ln
- 1812 Dena Dr
- 2214 Cedar Pointe Cir
- 2016 Kendal Ct
- 1908 Raquel Rd
- 2909 N Santa fe Ave
- 1508 George St
- 2324 Merlot Ct
- 2908 Longmeadow
- 800 Longmeadow Ct
- 2605 Oakcrest Dr
- 2601 Semillon Way
- 1700 Apache Trail
- 1624 Apache Trail
- 1633 Indian Springs Dr
- 1625 Indian Springs Dr
- 1616 Apache Trail
- 1708 Apache Trail
- 1633 Apache Trail
- 1617 Indian Springs Dr
- 1625 Apache Trail
- 1701 Apache Trail
- 1709 Indian Springs Dr
- 1716 Apache Trail
- 1617 Apache Trail
- 1709 Apache Trail
- 1717 Indian Springs Dr
- 1724 Apache Trail
- 1632 Redland Dr
- 1632 Indian Springs Dr
- 2516 Redrock Dr
- 1624 Redland Dr
Your Personal Tour Guide
Ask me questions while you tour the home.