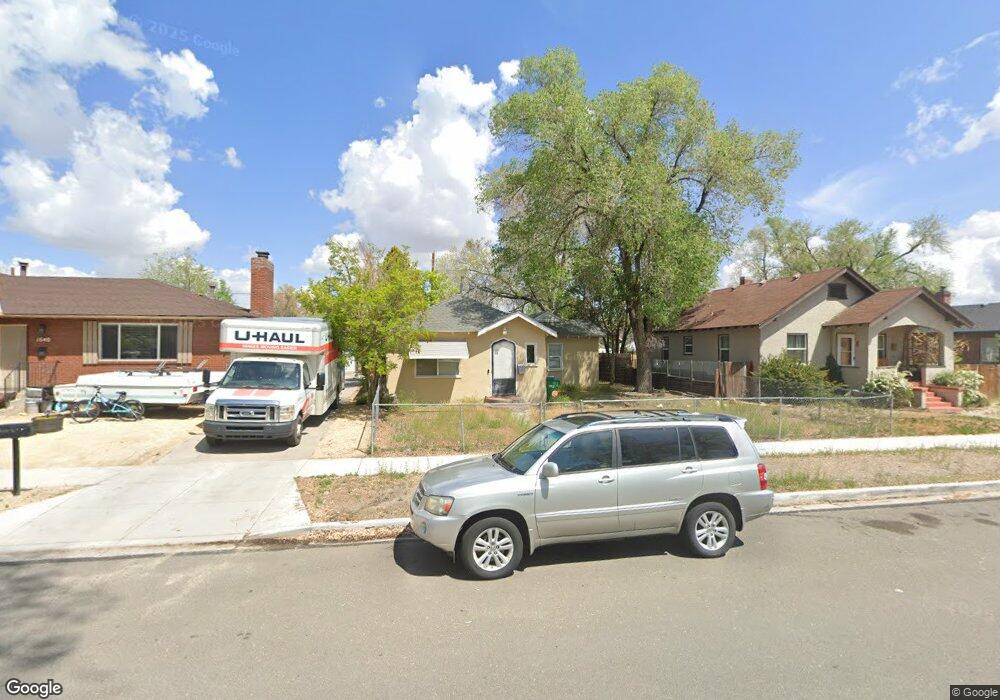
1632 F St Sparks, NV 89431
Downtown Sparks NeighborhoodEstimated Value: $276,979 - $450,000
3
Beds
2
Baths
1,324
Sq Ft
$287/Sq Ft
Est. Value
About This Home
This home is located at 1632 F St, Sparks, NV 89431 and is currently estimated at $380,495, approximately $287 per square foot. 1632 F St is a home located in Washoe County with nearby schools including Robert Mitchell Elementary School, Sparks Middle School, and Sparks High School.
Ownership History
Date
Name
Owned For
Owner Type
Purchase Details
Closed on
Jul 11, 2018
Sold by
Evans Richard C
Bought by
Evans Richard C and The Richard C Evans Family Trust
Current Estimated Value
Purchase Details
Closed on
May 2, 1996
Sold by
Goodwin David L and Goodwin Sheryl L
Bought by
Evans Richard C
Home Financials for this Owner
Home Financials are based on the most recent Mortgage that was taken out on this home.
Original Mortgage
$63,500
Outstanding Balance
$3,608
Interest Rate
7.97%
Estimated Equity
$376,887
Purchase Details
Closed on
Aug 23, 1994
Sold by
Goodwin David L and Goodwin Sheryl L
Bought by
Goodwin David L and Goodwin Sheryl L
Home Financials for this Owner
Home Financials are based on the most recent Mortgage that was taken out on this home.
Original Mortgage
$65,100
Interest Rate
8.65%
Purchase Details
Closed on
May 21, 1994
Sold by
Goodwin Dale L and Goodwin Anita M
Bought by
Goodwin David L and Goodwin Sheryl L
Create a Home Valuation Report for This Property
The Home Valuation Report is an in-depth analysis detailing your home's value as well as a comparison with similar homes in the area
Home Values in the Area
Average Home Value in this Area
Purchase History
| Date | Buyer | Sale Price | Title Company |
|---|---|---|---|
| Evans Richard C | -- | None Available | |
| Evans Richard C | $93,500 | First Centennial Title Co | |
| Goodwin David L | -- | First American Title Company | |
| Goodwin David L | -- | -- |
Source: Public Records
Mortgage History
| Date | Status | Borrower | Loan Amount |
|---|---|---|---|
| Open | Evans Richard C | $63,500 | |
| Previous Owner | Goodwin David L | $65,100 |
Source: Public Records
Tax History Compared to Growth
Tax History
| Year | Tax Paid | Tax Assessment Tax Assessment Total Assessment is a certain percentage of the fair market value that is determined by local assessors to be the total taxable value of land and additions on the property. | Land | Improvement |
|---|---|---|---|---|
| 2025 | $879 | $59,499 | $41,720 | $17,779 |
| 2024 | $879 | $56,184 | $38,710 | $17,474 |
| 2023 | $816 | $55,514 | $39,305 | $16,209 |
| 2022 | $792 | $46,106 | $32,865 | $13,241 |
| 2021 | $738 | $38,261 | $25,375 | $12,886 |
| 2020 | $716 | $38,893 | $26,250 | $12,643 |
| 2019 | $695 | $34,448 | $22,470 | $11,978 |
| 2018 | $679 | $26,657 | $15,190 | $11,467 |
| 2017 | $656 | $25,250 | $14,000 | $11,250 |
| 2016 | $643 | $22,489 | $11,200 | $11,289 |
| 2015 | $644 | $19,101 | $8,050 | $11,051 |
| 2014 | $625 | $17,392 | $7,000 | $10,392 |
| 2013 | -- | $16,350 | $6,160 | $10,190 |
Source: Public Records
Map
Nearby Homes