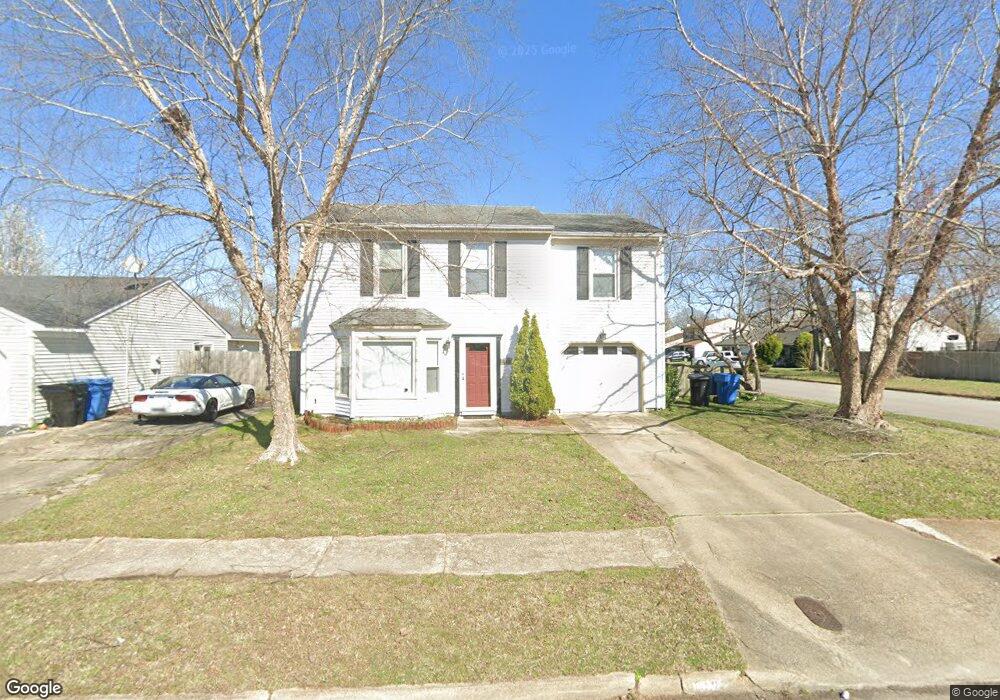
1632 High Plains Dr Virginia Beach, VA 23464
Estimated Value: $357,000 - $425,000
4
Beds
3
Baths
1,468
Sq Ft
$257/Sq Ft
Est. Value
About This Home
This home is located at 1632 High Plains Dr, Virginia Beach, VA 23464 and is currently estimated at $377,573, approximately $257 per square foot. 1632 High Plains Dr is a home located in Virginia Beach City with nearby schools including Rosemont Forest Elementary School, Salem Middle School, and Salem High School.
Ownership History
Date
Name
Owned For
Owner Type
Purchase Details
Closed on
Aug 24, 2015
Sold by
Ngo Adrian Garcia and Ngo Anna E
Bought by
Lewis Wesley L
Current Estimated Value
Home Financials for this Owner
Home Financials are based on the most recent Mortgage that was taken out on this home.
Original Mortgage
$229,837
Outstanding Balance
$181,133
Interest Rate
4.09%
Mortgage Type
VA
Estimated Equity
$196,440
Purchase Details
Closed on
Dec 27, 2012
Sold by
Bone Dianne H
Bought by
Ngo Adrian G and Ngo Anna E
Home Financials for this Owner
Home Financials are based on the most recent Mortgage that was taken out on this home.
Original Mortgage
$204,197
Interest Rate
3.35%
Mortgage Type
VA
Purchase Details
Closed on
Nov 18, 2002
Sold by
Parker Jacqueline D
Bought by
Bone Dianne H
Home Financials for this Owner
Home Financials are based on the most recent Mortgage that was taken out on this home.
Original Mortgage
$55,000
Interest Rate
6.19%
Mortgage Type
New Conventional
Create a Home Valuation Report for This Property
The Home Valuation Report is an in-depth analysis detailing your home's value as well as a comparison with similar homes in the area
Home Values in the Area
Average Home Value in this Area
Purchase History
| Date | Buyer | Sale Price | Title Company |
|---|---|---|---|
| Lewis Wesley L | $225,000 | -- | |
| Ngo Adrian G | $199,900 | -- | |
| Bone Dianne H | $91,000 | -- |
Source: Public Records
Mortgage History
| Date | Status | Borrower | Loan Amount |
|---|---|---|---|
| Open | Lewis Wesley L | $229,837 | |
| Previous Owner | Ngo Adrian G | $204,197 | |
| Previous Owner | Bone Dianne H | $55,000 |
Source: Public Records
Tax History Compared to Growth
Tax History
| Year | Tax Paid | Tax Assessment Tax Assessment Total Assessment is a certain percentage of the fair market value that is determined by local assessors to be the total taxable value of land and additions on the property. | Land | Improvement |
|---|---|---|---|---|
| 2025 | $2,911 | $310,900 | $120,000 | $190,900 |
| 2024 | $2,911 | $300,100 | $115,000 | $185,100 |
| 2023 | $2,848 | $287,700 | $100,000 | $187,700 |
| 2022 | $2,592 | $261,800 | $100,000 | $161,800 |
| 2021 | $2,255 | $227,800 | $88,000 | $139,800 |
| 2020 | $2,262 | $222,300 | $83,000 | $139,300 |
| 2019 | $2,202 | $211,900 | $78,000 | $133,900 |
| 2018 | $2,124 | $211,900 | $78,000 | $133,900 |
| 2017 | $2,027 | $202,200 | $74,000 | $128,200 |
| 2016 | $2,002 | $202,200 | $74,000 | $128,200 |
| 2015 | $1,877 | $189,600 | $72,400 | $117,200 |
| 2014 | $1,737 | $183,100 | $80,400 | $102,700 |
Source: Public Records
Map
Nearby Homes
- 1287 Bridle Creek Blvd
- 1612 Rodeo Dr
- 1550 Sangaree Cir
- 1324 Hafford Rd
- 1613 Cliffwood Dr
- 5149 Rugby Rd
- 1367 Hafford Rd
- 1593 Mill Oak Dr
- 4748 Ardmore Ln
- 1617 Sweet Bay Ct
- 4736 Ardmore Ln
- 4764 Ardmore Ln
- 4587 Greenlaw Dr
- 4905 Hillswick Dr
- 1505 Hadley Ct
- 1421 Eddystone Dr Unit X9192
- 5029 Hillswick Dr
- 1608 Notley Dr
- 4706 Greenlaw Dr
- 1912 Bunnell Ct
- 1630 High Plains Dr
- 1234 Saddlebred Dr
- 1636 High Plains Dr
- 1628 High Plains Dr
- 1232 Saddlebred Dr
- 1245 Quarter Way
- 1635 High Plains Dr
- 1638 High Plains Dr
- 1633 High Plains Dr
- 1637 High Plains Dr
- 1230 Saddlebred Dr
- 1221 Saddlebred Dr
- 1631 High Plains Dr
- 1639 High Plains Dr
- 1243 Quarter Way
- 1629 High Plains Dr
- 1640 High Plains Dr
- 1228 Saddlebred Dr
- 1641 High Plains Dr
- 1219 Saddlebred Dr