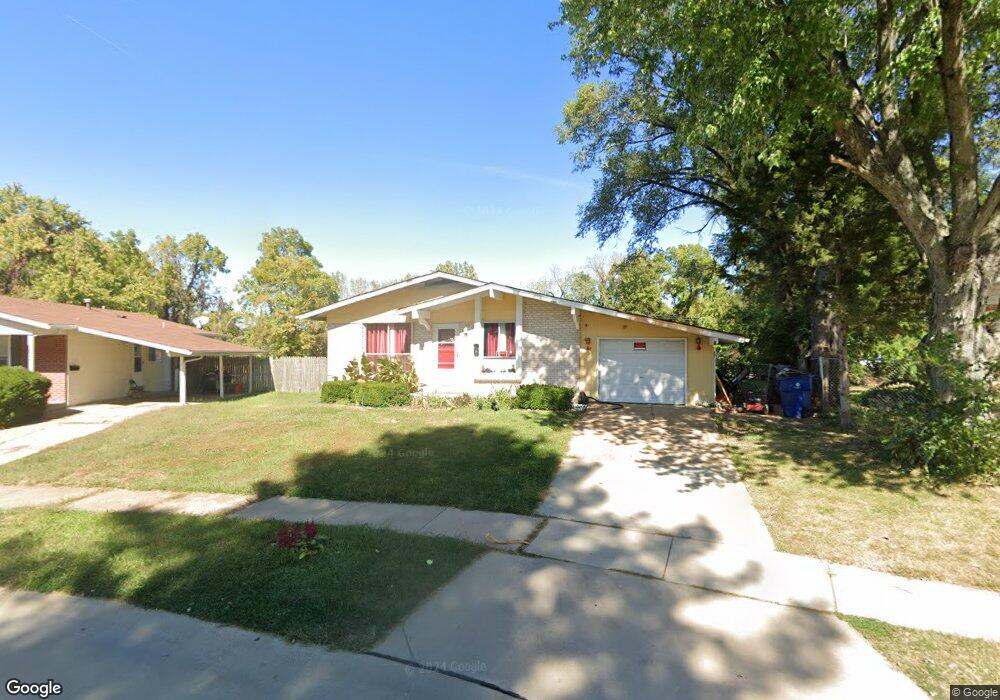
1632 Rudelle Dr Florissant, MO 63031
Estimated Value: $154,000 - $215,000
3
Beds
2
Baths
1,102
Sq Ft
$165/Sq Ft
Est. Value
About This Home
This home is located at 1632 Rudelle Dr, Florissant, MO 63031 and is currently estimated at $181,810, approximately $164 per square foot. 1632 Rudelle Dr is a home located in St. Louis County with nearby schools including North Middle School, Hazelwood Central High School, and Oak Bridge.
Ownership History
Date
Name
Owned For
Owner Type
Purchase Details
Closed on
Jun 18, 2004
Sold by
Edrington David K and Edrington Katherine E
Bought by
Johnson Reid Lareecia
Current Estimated Value
Home Financials for this Owner
Home Financials are based on the most recent Mortgage that was taken out on this home.
Original Mortgage
$92,610
Outstanding Balance
$51,769
Interest Rate
8.2%
Mortgage Type
Purchase Money Mortgage
Estimated Equity
$130,041
Purchase Details
Closed on
Feb 23, 2000
Sold by
United Companies Lending Corp
Bought by
Edrington David K and Edrington Katherine E
Purchase Details
Closed on
Dec 1, 1999
Sold by
George Penton
Bought by
United Companies Lending Corp
Purchase Details
Closed on
Sep 18, 1997
Sold by
Scott William C & Ann M Trustees and Marie Ann
Bought by
Penton Ii George
Home Financials for this Owner
Home Financials are based on the most recent Mortgage that was taken out on this home.
Original Mortgage
$47,200
Interest Rate
9.87%
Create a Home Valuation Report for This Property
The Home Valuation Report is an in-depth analysis detailing your home's value as well as a comparison with similar homes in the area
Home Values in the Area
Average Home Value in this Area
Purchase History
| Date | Buyer | Sale Price | Title Company |
|---|---|---|---|
| Johnson Reid Lareecia | $102,900 | Capital Title Co Inc | |
| Edrington David K | $47,000 | -- | |
| United Companies Lending Corp | $41,300 | First American Title | |
| Penton Ii George | -- | -- |
Source: Public Records
Mortgage History
| Date | Status | Borrower | Loan Amount |
|---|---|---|---|
| Open | Johnson Reid Lareecia | $92,610 | |
| Previous Owner | Penton Ii George | $47,200 | |
| Closed | Penton Ii George | $8,850 | |
| Closed | Johnson Reid Lareecia | $5,145 |
Source: Public Records
Tax History Compared to Growth
Tax History
| Year | Tax Paid | Tax Assessment Tax Assessment Total Assessment is a certain percentage of the fair market value that is determined by local assessors to be the total taxable value of land and additions on the property. | Land | Improvement |
|---|---|---|---|---|
| 2025 | $2,330 | $30,630 | $5,760 | $24,870 |
| 2024 | $2,330 | $26,620 | $2,300 | $24,320 |
| 2023 | $2,327 | $26,620 | $2,300 | $24,320 |
| 2022 | $1,990 | $20,250 | $3,760 | $16,490 |
| 2021 | $1,962 | $20,250 | $3,760 | $16,490 |
| 2020 | $1,870 | $17,960 | $5,760 | $12,200 |
| 2019 | $1,842 | $17,960 | $5,760 | $12,200 |
| 2018 | $1,634 | $14,630 | $1,880 | $12,750 |
| 2017 | $1,632 | $14,630 | $1,880 | $12,750 |
| 2016 | $1,664 | $14,720 | $2,220 | $12,500 |
| 2015 | $1,629 | $14,720 | $2,220 | $12,500 |
| 2014 | $1,574 | $14,650 | $3,650 | $11,000 |
Source: Public Records
Map
Nearby Homes
- 3660 Woodman Dr
- 3645 Woodman Dr
- 2 Aspen II at Riverstone
- 3932 Secretariat Dr
- 2 Ashford at Riverstone
- 16787 River Stone Dr
- 3844 Rapids Dr
- 2 Maple at Riverstone
- 1323 Woodpath Dr
- 2 Berwick at Riverstone
- 3828 Sonora Stone Dr
- 3840 Sonora Stone Dr
- 16804 River Stone Dr
- 3839 Sonora Stone Dr
- 2 Aspen at Riverstone
- 1455 Burnside Ct
- 1807 Kilmory Dr
- 3809 Albers Pointe Dr
- 1056 Saratoga Springs Ct
- 16256 Rose Wreath Ln Unit 156
- 1642 Rudelle Dr
- 1622 Rudelle Dr
- 1652 Rudelle Dr
- 1662 Rudelle Dr
- 3753 Rudelle Dr
- 1663 Rudelle Dr
- 1672 Rudelle Dr
- 3733 Rudelle Dr
- 1673 Rudelle Dr
- 1692 Rudelle Dr
- 1683 Rudelle Dr
- 1702 Rudelle Dr
- 1693 Rudelle Dr
- 1646 Ryall Ct
- 1200 Bold Ruler Ct
- 1712 Rudelle Dr
- 1703 Rudelle Dr
- 3764 Secretariat Dr
- 3768 Secretariat Dr
- 3760 Secretariat Dr