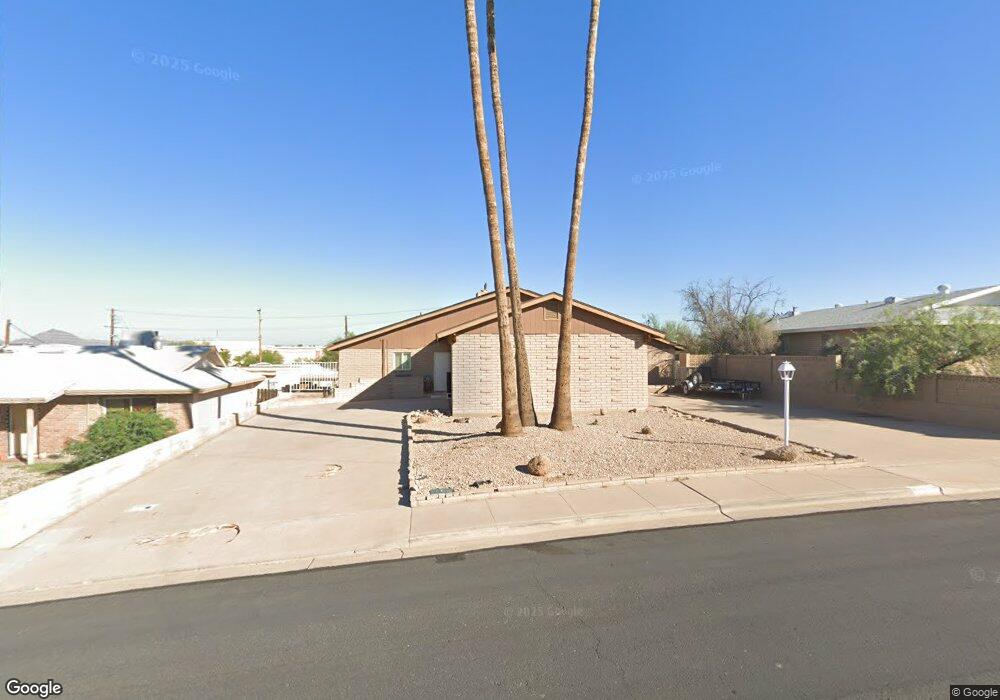
1632 W Mountain View Dr Mesa, AZ 85201
Riverview NeighborhoodEstimated Value: $480,000 - $530,000
Studio
2
Baths
2,287
Sq Ft
$217/Sq Ft
Est. Value
About This Home
This home is located at 1632 W Mountain View Dr, Mesa, AZ 85201 and is currently estimated at $496,547, approximately $217 per square foot. 1632 W Mountain View Dr is a home located in Maricopa County with nearby schools including Whittier Elementary School, Franklin at Brimhall Elementary School, and Franklin West Elementary School.
Ownership History
Date
Name
Owned For
Owner Type
Purchase Details
Closed on
Sep 23, 2002
Sold by
Pearson Linda L and Clark Terri L
Bought by
Fasbender Riley and Fasbender Deanna
Current Estimated Value
Home Financials for this Owner
Home Financials are based on the most recent Mortgage that was taken out on this home.
Original Mortgage
$148,500
Outstanding Balance
$73,749
Interest Rate
8.88%
Mortgage Type
Seller Take Back
Estimated Equity
$422,798
Purchase Details
Closed on
Aug 30, 1994
Sold by
Pearson Jerry L
Bought by
Pearson Linda L
Purchase Details
Closed on
Nov 9, 1993
Sold by
Pearson Dorothy
Bought by
Clark Harry John and Pearson Linda L
Create a Home Valuation Report for This Property
The Home Valuation Report is an in-depth analysis detailing your home's value as well as a comparison with similar homes in the area
Home Values in the Area
Average Home Value in this Area
Purchase History
| Date | Buyer | Sale Price | Title Company |
|---|---|---|---|
| Fasbender Riley | $167,000 | Capital Title Agency Inc | |
| Pearson Linda L | -- | Chicago Title Insurance Co | |
| Clark Harry John | -- | Chicago Title Insurance Co | |
| Pearson Dorothy | -- | Chicago Title Insurance Co |
Source: Public Records
Mortgage History
| Date | Status | Borrower | Loan Amount |
|---|---|---|---|
| Open | Fasbender Riley | $148,500 |
Source: Public Records
Tax History
| Year | Tax Paid | Tax Assessment Tax Assessment Total Assessment is a certain percentage of the fair market value that is determined by local assessors to be the total taxable value of land and additions on the property. | Land | Improvement |
|---|---|---|---|---|
| 2025 | $1,278 | $15,390 | -- | -- |
| 2024 | $1,292 | $14,657 | -- | -- |
| 2023 | $1,292 | $36,060 | $7,210 | $28,850 |
| 2022 | $1,264 | $27,780 | $5,550 | $22,230 |
| 2021 | $1,298 | $24,710 | $4,940 | $19,770 |
| 2020 | $1,281 | $25,160 | $5,030 | $20,130 |
| 2019 | $1,187 | $23,900 | $4,780 | $19,120 |
| 2018 | $1,133 | $20,770 | $4,150 | $16,620 |
| 2017 | $1,097 | $18,080 | $3,610 | $14,470 |
| 2016 | $1,078 | $15,730 | $3,140 | $12,590 |
| 2015 | $1,017 | $15,160 | $3,030 | $12,130 |
Source: Public Records
Map
Nearby Homes
- 1500 W Rio Salado Pkwy Unit 150
- 1500 W Rio Salado Pkwy Unit 28
- 1500 W Rio Salado Pkwy Unit 124
- 848 N Standage
- 1561 W 5th St
- 1431 W 5th Place
- 1301 W Rio Salado Pkwy Unit 15
- 1301 W Rio Salado Pkwy Unit 22
- 1301 W Rio Salado Pkwy Unit 51
- 1301 W Rio Salado Pkwy Unit 1
- 1265 W Ellis St
- 416 N Ash
- 1462 W University Dr
- 544 N Alma School Rd Unit 28
- 510 N Alma School Rd Unit 174
- 2106 W Devonshire St
- 601 N May Unit 25
- 1904 W 3rd St
- 1105 W 6th Place
- 1051 W Dixon St
- 1638 W Mountain View Dr
- 1624 W Mountain View Dr
- 1642 W Mountain View Dr
- 1616 W Mountain View Dr
- 1631 W Mountain View Dr
- 1623 W Mountain View Dr
- 1648 W Mountain View Dr
- 1641 W Mountain View Dr
- 1608 W Mountain View Dr
- 1615 W Mountain View Dr
- 1647 W Mountain View Dr
- 1652 W Mountain View Dr
- 1607 W Mountain View Dr
- 1630 W 7th Place
- 1622 W 7th Place
- 1634 W 7th Place
- 1614 W 7th Place
- 1655 W Mountain View Dr
- 1656 W Mountain View Dr
- 1606 W 7th Place
Your Personal Tour Guide
Ask me questions while you tour the home.