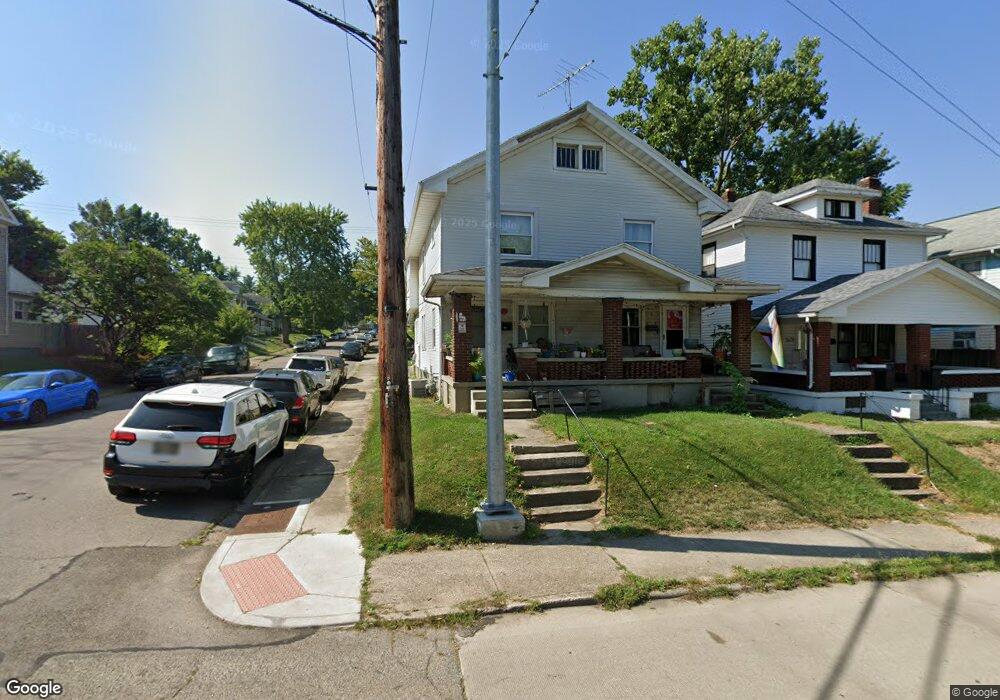
1632 Wyoming St Dayton, OH 45410
Walnut Hills NeighborhoodEstimated Value: $85,705 - $145,000
6
Beds
2
Baths
1,256
Sq Ft
$92/Sq Ft
Est. Value
About This Home
This home is located at 1632 Wyoming St, Dayton, OH 45410 and is currently estimated at $116,176, approximately $92 per square foot. 1632 Wyoming St is a home located in Montgomery County with nearby schools including Cleveland Elementary School, Horace Mann Elementary School, and Eastmont Elementary.
Ownership History
Date
Name
Owned For
Owner Type
Purchase Details
Closed on
Feb 11, 2021
Sold by
Mclaughlin Timothy
Bought by
Dayton Double Plus Llc
Current Estimated Value
Purchase Details
Closed on
Oct 26, 2020
Sold by
Mclaughlin Timothy and Mclaughlin Chelsea Breen
Bought by
Mclaughlin Timothy
Purchase Details
Closed on
May 15, 2018
Sold by
Luneke James and Luneke Pamela
Bought by
Mciaughlin Timothy and Mciaughlin Chelsea Breen
Home Financials for this Owner
Home Financials are based on the most recent Mortgage that was taken out on this home.
Original Mortgage
$30,000
Interest Rate
4.4%
Mortgage Type
New Conventional
Purchase Details
Closed on
Dec 28, 2004
Sold by
Jackson Sandra K
Bought by
Luneke James E and Luneke Pamela
Home Financials for this Owner
Home Financials are based on the most recent Mortgage that was taken out on this home.
Original Mortgage
$80,000
Interest Rate
5.9%
Mortgage Type
Fannie Mae Freddie Mac
Create a Home Valuation Report for This Property
The Home Valuation Report is an in-depth analysis detailing your home's value as well as a comparison with similar homes in the area
Home Values in the Area
Average Home Value in this Area
Purchase History
| Date | Buyer | Sale Price | Title Company |
|---|---|---|---|
| Dayton Double Plus Llc | -- | None Available | |
| Mclaughlin Timothy | -- | None Available | |
| Mciaughlin Timothy | $40,000 | Chicago Title Company Llc | |
| Luneke James E | $80,000 | None Available |
Source: Public Records
Mortgage History
| Date | Status | Borrower | Loan Amount |
|---|---|---|---|
| Previous Owner | Mciaughlin Timothy | $30,000 | |
| Previous Owner | Luneke James E | $80,000 |
Source: Public Records
Tax History Compared to Growth
Tax History
| Year | Tax Paid | Tax Assessment Tax Assessment Total Assessment is a certain percentage of the fair market value that is determined by local assessors to be the total taxable value of land and additions on the property. | Land | Improvement |
|---|---|---|---|---|
| 2024 | $635 | $10,750 | $4,740 | $6,010 |
| 2023 | $635 | $10,750 | $4,740 | $6,010 |
| 2022 | $667 | $8,740 | $3,860 | $4,880 |
| 2021 | $663 | $8,740 | $3,860 | $4,880 |
| 2020 | $662 | $8,740 | $3,860 | $4,880 |
| 2019 | $745 | $8,740 | $3,860 | $4,880 |
| 2018 | $1,412 | $17,060 | $3,860 | $13,200 |
| 2017 | $1,401 | $17,060 | $3,860 | $13,200 |
| 2016 | $1,461 | $16,930 | $3,860 | $13,070 |
| 2015 | $1,382 | $16,930 | $3,860 | $13,070 |
| 2014 | $1,382 | $16,930 | $3,860 | $13,070 |
| 2012 | -- | $18,120 | $3,890 | $14,230 |
Source: Public Records
Map
Nearby Homes
- 2010 Argyle Ave
- 1159 Highland Ave
- 2105 Wyoming St
- 722 Saint Nicholas Ave
- 708 Saint Nicholas Ave
- 853 Carlisle Ave
- 1254 Phillips Ave
- 1154 Demphle Ave
- 2012 Saint Charles Ave
- 624 Pritz Ave
- 1254 Creighton Ave
- 222 Illinois Ave
- 2316 Wyoming St
- 1105 Pursell Ave
- 1221 Arbor Ave
- 215 Heaton Ave
- 267 Indiana Ave
- 662 Carlisle Ave
- 621 Creighton Ave
- 208 Heaton Ave
- 1634 Wyoming St
- 1628 Wyoming St
- 1624 Wyoming St
- 1620 Wyoming St
- 1700 Wyoming St
- 1017 Pritz Ave
- 1616 Wyoming St
- 1704 Wyoming St
- 1021 Pritz Ave
- 1708 Wyoming St
- 1014 Pritz Ave
- 1020 Pritz Ave
- 1027 Pritz Ave
- 1712 Wyoming St
- 1022 Pritz Ave
- 1016 Highland Ave
- 1604 Wyoming St
- 1031 Pritz Ave
- 1020 Highland Ave
- 1028 Pritz Ave