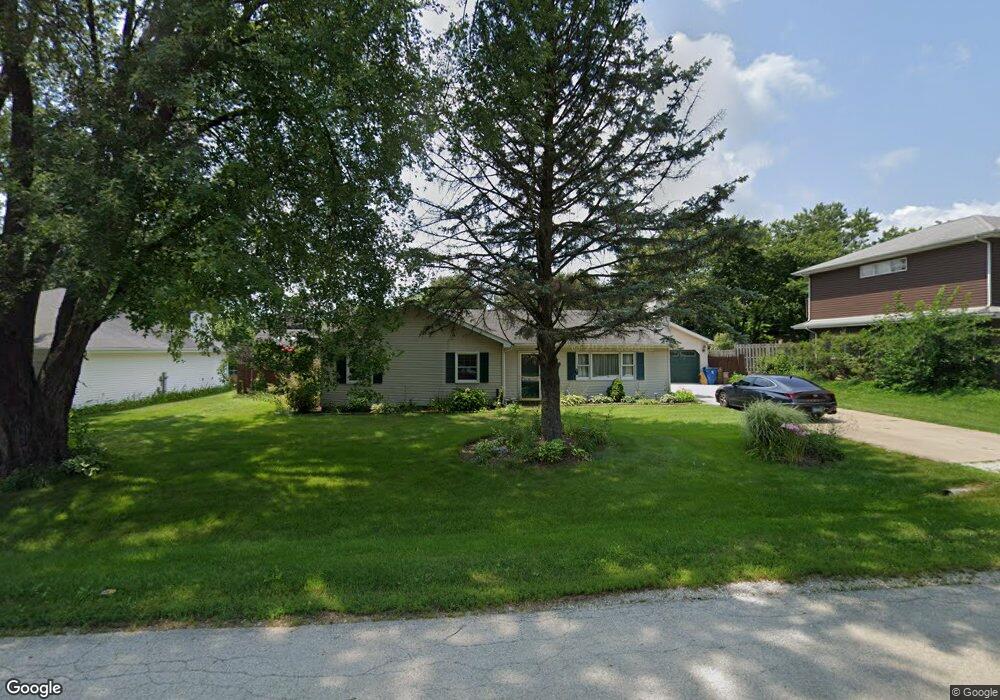
16320 S Mcgrath Dr Unit 4 Plainfield, IL 60586
East Plainfield NeighborhoodEstimated Value: $317,511 - $451,000
Studio
1
Bath
1,469
Sq Ft
$248/Sq Ft
Est. Value
About This Home
This home is located at 16320 S Mcgrath Dr Unit 4, Plainfield, IL 60586 and is currently estimated at $364,128, approximately $247 per square foot. 16320 S Mcgrath Dr Unit 4 is a home located in Will County with nearby schools including River View Elementary School, Timber Ridge Middle School, and Plainfield Central High School.
Ownership History
Date
Name
Owned For
Owner Type
Purchase Details
Closed on
Aug 26, 2005
Sold by
Ross Frederick M and Ross Karyn M
Bought by
Ross Karyn M
Current Estimated Value
Home Financials for this Owner
Home Financials are based on the most recent Mortgage that was taken out on this home.
Original Mortgage
$142,500
Outstanding Balance
$76,429
Interest Rate
5.89%
Mortgage Type
New Conventional
Estimated Equity
$287,699
Purchase Details
Closed on
Apr 30, 1998
Sold by
Kolb Randy W and Kolb Louise B
Bought by
Ross Frederick M and Ross Karyn M
Home Financials for this Owner
Home Financials are based on the most recent Mortgage that was taken out on this home.
Original Mortgage
$120,000
Interest Rate
7.18%
Create a Home Valuation Report for This Property
The Home Valuation Report is an in-depth analysis detailing your home's value as well as a comparison with similar homes in the area
Home Values in the Area
Average Home Value in this Area
Purchase History
| Date | Buyer | Sale Price | Title Company |
|---|---|---|---|
| Ross Karyn M | -- | Ticor Title Insurance | |
| Ross Frederick M | $123,333 | -- |
Source: Public Records
Mortgage History
| Date | Status | Borrower | Loan Amount |
|---|---|---|---|
| Open | Ross Karyn M | $142,500 | |
| Closed | Ross Frederick M | $120,000 |
Source: Public Records
Tax History
| Year | Tax Paid | Tax Assessment Tax Assessment Total Assessment is a certain percentage of the fair market value that is determined by local assessors to be the total taxable value of land and additions on the property. | Land | Improvement |
|---|---|---|---|---|
| 2024 | $6,016 | $94,813 | $24,697 | $70,116 |
| 2023 | $6,016 | $85,633 | $22,306 | $63,327 |
| 2022 | $5,425 | $76,910 | $20,034 | $56,876 |
| 2021 | $5,116 | $71,878 | $18,723 | $53,155 |
| 2020 | $5,043 | $69,839 | $18,192 | $51,647 |
| 2019 | $4,860 | $66,545 | $17,334 | $49,211 |
| 2018 | $4,835 | $64,956 | $16,286 | $48,670 |
| 2017 | $4,682 | $61,728 | $15,477 | $46,251 |
| 2016 | $4,563 | $58,873 | $14,761 | $44,112 |
| 2015 | $4,250 | $55,151 | $13,828 | $41,323 |
| 2014 | $4,250 | $53,204 | $13,340 | $39,864 |
| 2013 | $4,250 | $53,204 | $13,340 | $39,864 |
Source: Public Records
Map
Nearby Homes
- 25718 W Wakefield Dr
- 25720 W Wakefield Dr
- 23213 W Kennebec Dr
- 16212 S Howard St
- 23545 W Rueben St
- 25649 W Wakefield Dr
- 23105 W Oak St
- 23736 Dayfield Ct
- 25614 W Wakefield Dr
- 16636 Winding Creek Rd
- 25726 W Yorkshire Dr
- 25724 W Yorkshire Dr
- 0007 Illinois Route 59
- 0003 Illinois Route 59
- 0009 Illinois Route 59
- 0005 Illinois Route 59
- 0006 Illinois Route 59
- 23700 W Getson Ave
- 4022 Hennepin Dr Unit 171
- 3812 Hennepin Dr
- 16330 S Mcgrath Dr
- 23357 W Feeney Dr
- 16321 S George Ct
- 16331 S George Ct
- 16300 S George Ct
- 23334 W Leach Dr
- 16340 S Mcgrath Dr
- 16341 S George Ct
- 23335 W Feeney Dr
- 16256 S Mcgrath Dr
- 23324 W Leach Dr
- 16350 S Mcgrath Dr
- 16259 S George Ct
- 23339 W Leach Dr
- 16351 S George Ct
- 23336 W Feeney Dr
- 16246 S Mcgrath Dr
- 23329 W Leach Dr
- 16330 S George Ct
- 16360 S Mcgrath Dr