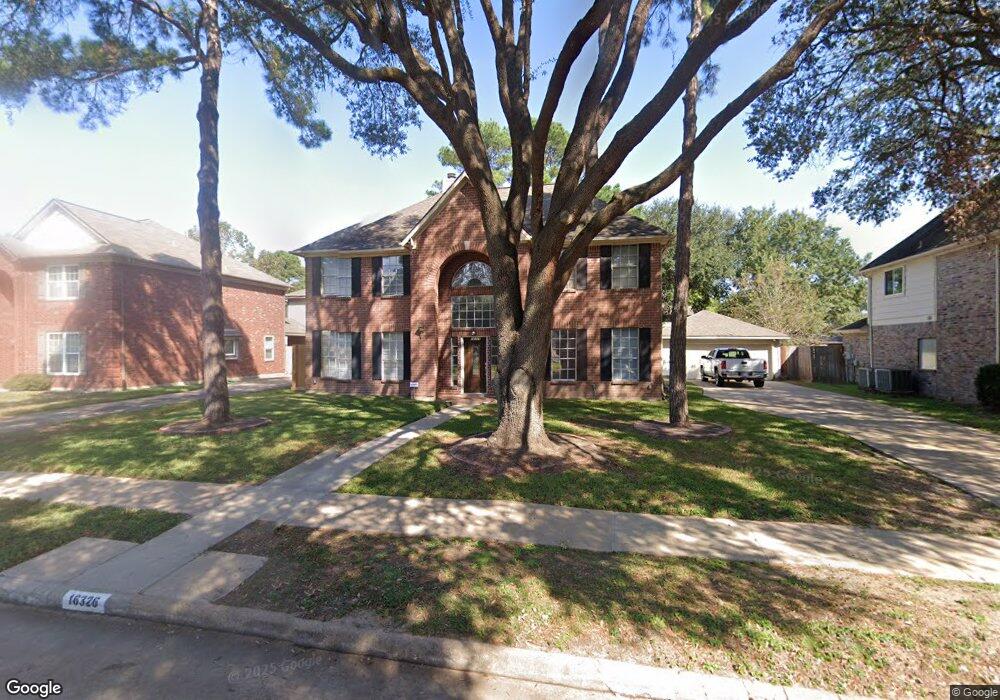
16326 Battlecreek Dr Houston, TX 77095
Copperfield NeighborhoodEstimated Value: $335,000 - $372,000
4
Beds
3
Baths
2,946
Sq Ft
$119/Sq Ft
Est. Value
About This Home
This home is located at 16326 Battlecreek Dr, Houston, TX 77095 and is currently estimated at $350,422, approximately $118 per square foot. 16326 Battlecreek Dr is a home located in Harris County with nearby schools including Birkes Elementary School, Aragon Middle School, and Langham Creek High School.
Ownership History
Date
Name
Owned For
Owner Type
Purchase Details
Closed on
Aug 28, 2014
Sold by
Adame Juana C
Bought by
Adame Rumaldo
Current Estimated Value
Purchase Details
Closed on
Apr 15, 1999
Sold by
Naftel Robert Jeffrey and Naftel Tania
Bought by
Davis John L and Davis Stacie D
Home Financials for this Owner
Home Financials are based on the most recent Mortgage that was taken out on this home.
Original Mortgage
$77,759
Outstanding Balance
$19,739
Interest Rate
7.07%
Mortgage Type
Purchase Money Mortgage
Estimated Equity
$330,683
Purchase Details
Closed on
Jan 12, 1994
Sold by
Dover Homes Inc
Bought by
Adame Rumaldo U and Adame Juana C
Home Financials for this Owner
Home Financials are based on the most recent Mortgage that was taken out on this home.
Original Mortgage
$103,900
Interest Rate
7.23%
Create a Home Valuation Report for This Property
The Home Valuation Report is an in-depth analysis detailing your home's value as well as a comparison with similar homes in the area
Home Values in the Area
Average Home Value in this Area
Purchase History
| Date | Buyer | Sale Price | Title Company |
|---|---|---|---|
| Adame Rumaldo | -- | None Available | |
| Davis John L | -- | Regency Title Company | |
| Adame Rumaldo U | -- | Commonwealth Land Title Co O |
Source: Public Records
Mortgage History
| Date | Status | Borrower | Loan Amount |
|---|---|---|---|
| Open | Davis John L | $77,759 | |
| Previous Owner | Adame Rumaldo U | $103,900 |
Source: Public Records
Tax History Compared to Growth
Tax History
| Year | Tax Paid | Tax Assessment Tax Assessment Total Assessment is a certain percentage of the fair market value that is determined by local assessors to be the total taxable value of land and additions on the property. | Land | Improvement |
|---|---|---|---|---|
| 2025 | $2,164 | $328,191 | $68,522 | $259,669 |
| 2024 | $2,164 | $317,455 | $68,522 | $248,933 |
| 2023 | $2,164 | $328,104 | $68,522 | $259,582 |
| 2022 | $190 | $306,610 | $42,742 | $263,868 |
| 2021 | $7,097 | $240,834 | $42,742 | $198,092 |
| 2020 | $6,759 | $223,481 | $35,618 | $187,863 |
| 2019 | $6,776 | $218,186 | $35,618 | $182,568 |
| 2018 | $1,738 | $213,372 | $35,618 | $177,754 |
| 2017 | $6,539 | $206,506 | $35,618 | $170,888 |
| 2016 | $6,539 | $206,506 | $35,618 | $170,888 |
| 2015 | $5,574 | $206,506 | $35,618 | $170,888 |
| 2014 | $5,574 | $176,157 | $28,494 | $147,663 |
Source: Public Records
Map
Nearby Homes
- 16315 Battlecreek Dr
- 16319 Chimneystone Dr
- 16510 Wellers Way
- 16215 Wemyss Bay Rd
- 16215 Cairngorm Ave
- 16535 Oat Mill Dr
- 7622 Mccormick Mill Ct
- 7614 Mccormick Mill Ct
- 16335 Drystone Ln
- 16114 Kintyre Point Rd
- 16514 Innisbrook Dr
- 16026 Autumn Falls Ln
- 16606 Stoneside Dr
- 16511 Crystal View Ct
- 16426 Torry View Terrace
- 16030 Royal Garden Dr
- 7719 Woodlett Ct
- 8426 Laurel Trails Dr
- 16403 Torry View Terrace
- 8550 Waiting Spring Ln
- 16322 Battlecreek Dr
- 16402 Battlecreek Dr
- 16407 Wellers Way
- 16321 Wellers Way
- 16318 Battlecreek Dr
- 16406 Battlecreek Dr
- 16411 Wellers Way
- 16327 Battlecreek Dr
- 16314 Battlecreek Dr
- 16323 Battlecreek Dr
- 16415 Wellers Way
- 16313 Wellers Way
- 16410 Battlecreek Dr
- 16407 Battlecreek Dr
- 16319 Battlecreek Dr
- 16310 Battlecreek Dr
- 16419 Wellers Way
- 16411 Battlecreek Dr
- 16309 Wellers Way
- 16406 Wellers Way