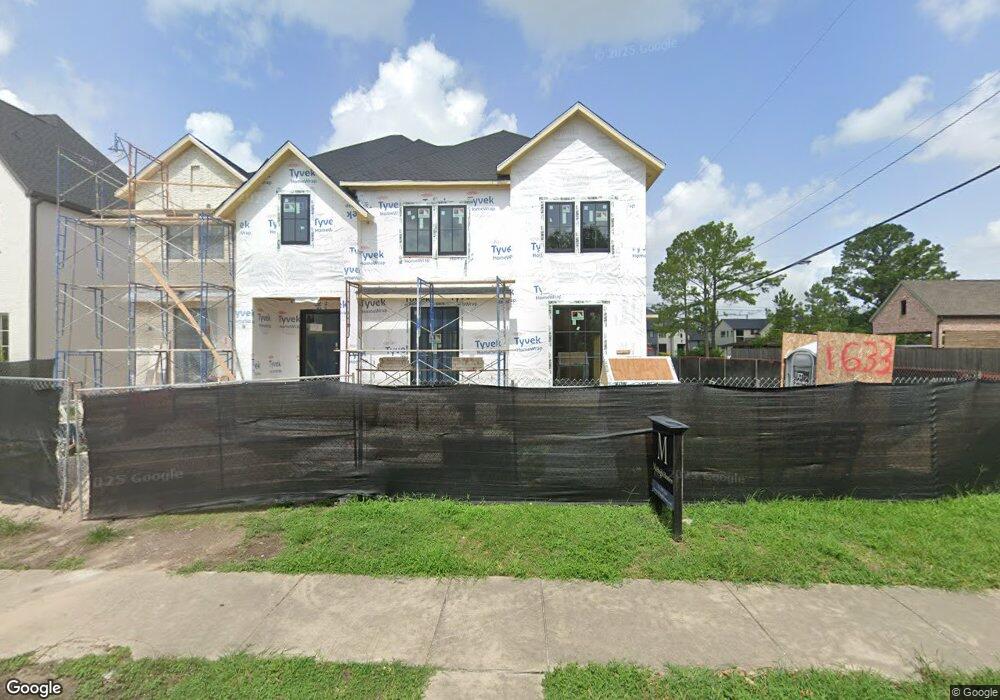
1633 Bayram Dr Houston, TX 77055
Spring Branch East NeighborhoodEstimated Value: $619,500
4
Beds
2
Baths
2,031
Sq Ft
$305/Sq Ft
Est. Value
About This Home
This home is located at 1633 Bayram Dr, Houston, TX 77055 and is currently priced at $619,500, approximately $305 per square foot. 1633 Bayram Dr is a home located in Harris County with nearby schools including Valley Oaks Elementary School, Landrum Middle School, and Memorial High School.
Ownership History
Date
Name
Owned For
Owner Type
Purchase Details
Closed on
May 4, 2021
Sold by
Mchugh Paul and Mchugh Heather
Bought by
Mchugh Homes Llc
Current Estimated Value
Home Financials for this Owner
Home Financials are based on the most recent Mortgage that was taken out on this home.
Original Mortgage
$1,067,388
Outstanding Balance
$967,320
Interest Rate
3.1%
Mortgage Type
Construction
Purchase Details
Closed on
Mar 7, 2013
Sold by
Mclaurin Erika Hunter and Hunter Deirdre
Bought by
Mchugh Paul and Mchugh Heather
Home Financials for this Owner
Home Financials are based on the most recent Mortgage that was taken out on this home.
Original Mortgage
$173,700
Interest Rate
3.44%
Mortgage Type
New Conventional
Purchase Details
Closed on
Jan 23, 2004
Sold by
Smith Michael B
Bought by
Haden Properties Llc
Home Financials for this Owner
Home Financials are based on the most recent Mortgage that was taken out on this home.
Original Mortgage
$110,650
Interest Rate
5.78%
Mortgage Type
Purchase Money Mortgage
Create a Home Valuation Report for This Property
The Home Valuation Report is an in-depth analysis detailing your home's value as well as a comparison with similar homes in the area
Home Values in the Area
Average Home Value in this Area
Purchase History
| Date | Buyer | Sale Price | Title Company |
|---|---|---|---|
| Mchugh Homes Llc | -- | Stewart Title | |
| Mchugh Paul | -- | None Available | |
| Haden Properties Llc | -- | Fidelity National Title |
Source: Public Records
Mortgage History
| Date | Status | Borrower | Loan Amount |
|---|---|---|---|
| Open | Mchugh Homes Llc | $1,067,388 | |
| Previous Owner | Mchugh Paul | $173,700 | |
| Previous Owner | Haden Properties Llc | $110,650 |
Source: Public Records
Tax History Compared to Growth
Tax History
| Year | Tax Paid | Tax Assessment Tax Assessment Total Assessment is a certain percentage of the fair market value that is determined by local assessors to be the total taxable value of land and additions on the property. | Land | Improvement |
|---|---|---|---|---|
| 2023 | $9,696 | $434,160 | $434,160 | $0 |
| 2022 | $8,882 | $379,890 | $379,890 | $0 |
| 2021 | $9,678 | $478,838 | $382,725 | $96,113 |
| 2020 | $8,909 | $417,892 | $328,050 | $89,842 |
| 2019 | $5,900 | $417,892 | $328,050 | $89,842 |
| 2018 | $2,766 | $403,300 | $328,050 | $75,250 |
| 2017 | $2,506 | $403,300 | $328,050 | $75,250 |
| 2016 | $4,539 | $414,274 | $328,050 | $86,224 |
| 2015 | $5,137 | $404,671 | $309,825 | $94,846 |
| 2014 | $5,137 | $193,000 | $145,800 | $47,200 |
Source: Public Records
Map
Nearby Homes
- 1701 Bayram Dr
- 1719 Bayram Dr
- 1607 W Rose Terrace Ln
- 8603 Costmary Ln
- 1653 Bingle Rd
- 1614 Ojeman Rd Unit E
- 1614 Ojeman Rd Unit J
- 1526 Ojeman Rd Unit A
- 8706 Strongoak Ln
- 1704 Sedola Ln
- 1720 Sedola Ln
- 2034 Bingle Rd
- 1705 Bologna Ln
- 1711 Bologna Ln
- 1707 Bologna Ln
- 1709 Bologna Ln
- 1441 Bingle Rd
- 1715 Bologna Ln
- 1510 Longacre Dr
- 1506 Longacre Dr