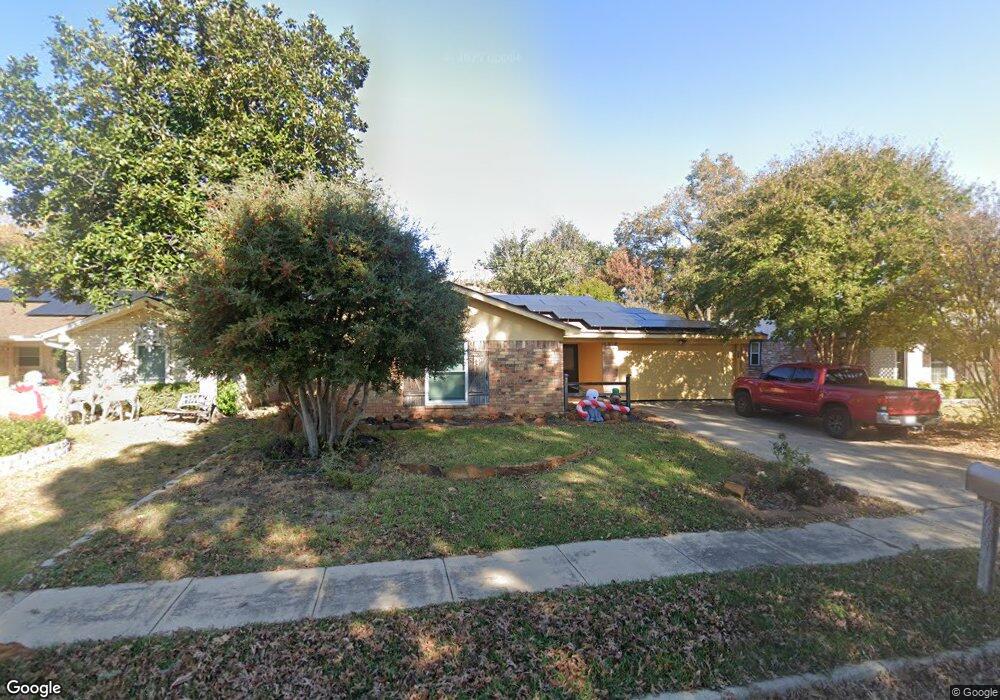
1633 Lexington Place Bedford, TX 76022
Estimated Value: $355,203 - $401,000
3
Beds
2
Baths
2,075
Sq Ft
$181/Sq Ft
Est. Value
About This Home
This home is located at 1633 Lexington Place, Bedford, TX 76022 and is currently estimated at $375,801, approximately $181 per square foot. 1633 Lexington Place is a home located in Tarrant County with nearby schools including Bell Manor Elementary School, Central J High School, and Trinity High School.
Ownership History
Date
Name
Owned For
Owner Type
Purchase Details
Closed on
Dec 29, 2016
Sold by
Brady Michael J and Brady Emily J
Bought by
Maddux Scott D and Maddux Teresa W
Current Estimated Value
Home Financials for this Owner
Home Financials are based on the most recent Mortgage that was taken out on this home.
Original Mortgage
$182,000
Outstanding Balance
$90,049
Interest Rate
3.94%
Mortgage Type
New Conventional
Estimated Equity
$285,752
Purchase Details
Closed on
Sep 12, 2011
Sold by
Plemmons Randal Wayne
Bought by
Brady Michael J and Brady Emily J
Home Financials for this Owner
Home Financials are based on the most recent Mortgage that was taken out on this home.
Original Mortgage
$105,262
Interest Rate
4.5%
Mortgage Type
FHA
Create a Home Valuation Report for This Property
The Home Valuation Report is an in-depth analysis detailing your home's value as well as a comparison with similar homes in the area
Home Values in the Area
Average Home Value in this Area
Purchase History
| Date | Buyer | Sale Price | Title Company |
|---|---|---|---|
| Maddux Scott D | -- | Fidelity National Title | |
| Brady Michael J | -- | Ttt |
Source: Public Records
Mortgage History
| Date | Status | Borrower | Loan Amount |
|---|---|---|---|
| Open | Maddux Scott D | $182,000 | |
| Previous Owner | Brady Michael J | $105,262 |
Source: Public Records
Tax History Compared to Growth
Tax History
| Year | Tax Paid | Tax Assessment Tax Assessment Total Assessment is a certain percentage of the fair market value that is determined by local assessors to be the total taxable value of land and additions on the property. | Land | Improvement |
|---|---|---|---|---|
| 2025 | $5,321 | $337,500 | $65,000 | $272,500 |
| 2024 | $5,321 | $350,000 | $65,000 | $285,000 |
| 2023 | $5,906 | $319,418 | $45,000 | $274,418 |
| 2022 | $6,114 | $303,006 | $45,000 | $258,006 |
| 2021 | $5,995 | $254,480 | $45,000 | $209,480 |
| 2020 | $5,835 | $245,427 | $45,000 | $200,427 |
| 2019 | $6,004 | $247,155 | $45,000 | $202,155 |
| 2018 | $5,255 | $216,312 | $18,000 | $198,312 |
| 2017 | $4,649 | $192,195 | $18,000 | $174,195 |
| 2016 | $4,292 | $177,428 | $18,000 | $159,428 |
| 2015 | $3,454 | $164,818 | $18,000 | $146,818 |
| 2014 | $3,454 | $148,500 | $18,000 | $130,500 |
Source: Public Records
Map
Nearby Homes
- 1701 Winchester Way
- 1613 Trinity Ct
- 933 Charleston Ct
- 1031 Boston Blvd
- 1604 Richmond Dr
- 952 Charleston Dr
- 904 Nelson Terrace
- 1004 Overhill Dr
- 921 Overhill Dr
- 909 Overhill Dr
- 804 Natchez Ave
- 1204 Edgecliff Dr
- 2024 Charleston Dr
- 1509 Shirley Way
- 2101 Gettysburg Place
- 2025 Schumac Ln
- 2201 Greendale Ct
- 1213 Briar Dr
- 1213 Greendale Dr
- 828 Gregory Ave
- 1629 Lexington Place
- 1637 Lexington Place
- 1625 Lexington Place
- 1640 Knoxville Dr
- 1636 Knoxville Dr
- 1644 Knoxville Dr
- 1632 Knoxville Dr
- 1628 Lexington Place
- 1621 Lexington Place
- 1632 Lexington Place
- 1624 Lexington Place
- 1628 Knoxville Dr
- 1100 Monterrey St
- 1104 Monterrey St
- 1620 Lexington Place
- 1617 Lexington Place
- 1108 Monterrey St
- 1028 Monterrey St
- 1624 Knoxville Dr
- 1616 Lexington Place