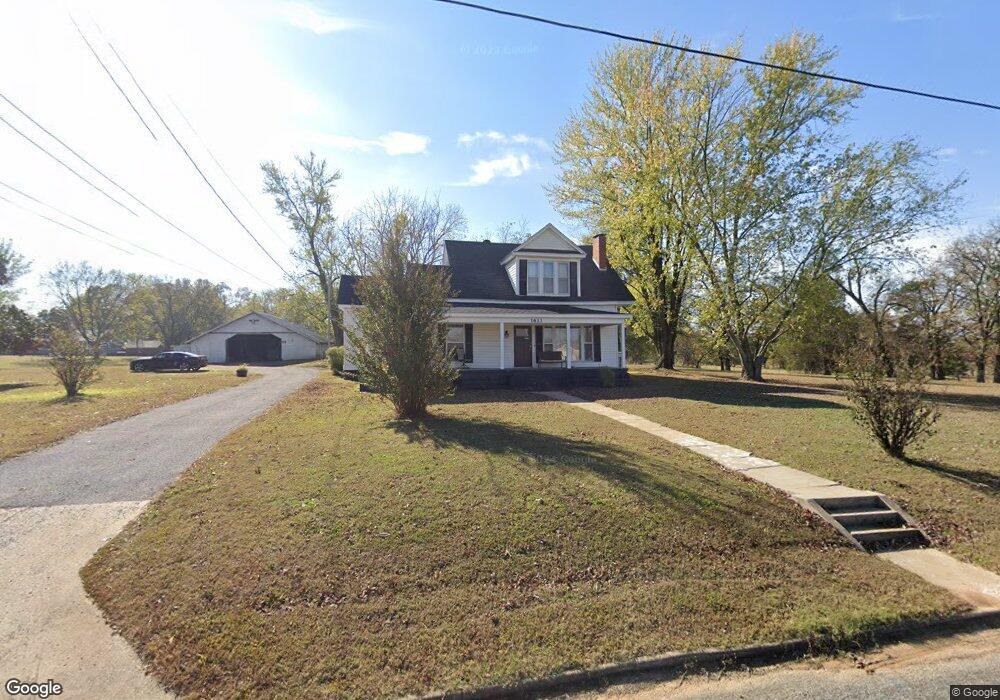
1633 Mulberry Highway 64 W Mulberry, AR 72947
Estimated Value: $189,000 - $303,000
--
Bed
2
Baths
2,190
Sq Ft
$111/Sq Ft
Est. Value
About This Home
This home is located at 1633 Mulberry Highway 64 W, Mulberry, AR 72947 and is currently estimated at $242,924, approximately $110 per square foot. 1633 Mulberry Highway 64 W is a home located in Crawford County with nearby schools including Marvin Primary School, Pleasant View Junior High School, and Mulberry High School.
Ownership History
Date
Name
Owned For
Owner Type
Purchase Details
Closed on
Jul 7, 2023
Sold by
Clark Victor
Bought by
Clark Victor and Branham Candace
Current Estimated Value
Home Financials for this Owner
Home Financials are based on the most recent Mortgage that was taken out on this home.
Original Mortgage
$15,000
Interest Rate
6.39%
Mortgage Type
New Conventional
Purchase Details
Closed on
Jun 15, 2023
Sold by
Higgins Dewayne and Higgins Deborah
Bought by
Clark Victor
Home Financials for this Owner
Home Financials are based on the most recent Mortgage that was taken out on this home.
Original Mortgage
$15,000
Interest Rate
6.39%
Mortgage Type
New Conventional
Purchase Details
Closed on
Nov 3, 2021
Sold by
Reynolds Jr Jerry E
Bought by
Higgins Dewayne and Higgins Deborah
Purchase Details
Closed on
Nov 18, 1996
Bought by
Roe-Reynolds
Purchase Details
Closed on
Feb 23, 1994
Bought by
Reyonlds-Roe
Create a Home Valuation Report for This Property
The Home Valuation Report is an in-depth analysis detailing your home's value as well as a comparison with similar homes in the area
Home Values in the Area
Average Home Value in this Area
Purchase History
| Date | Buyer | Sale Price | Title Company |
|---|---|---|---|
| Clark Victor | -- | None Listed On Document | |
| Clark Victor | $190,000 | Advantage Title & Escrow | |
| Higgins Dewayne | $100,000 | Crawford County Abstract | |
| Roe-Reynolds | $61,000 | -- | |
| Reyonlds-Roe | $50,000 | -- |
Source: Public Records
Mortgage History
| Date | Status | Borrower | Loan Amount |
|---|---|---|---|
| Closed | Clark Victor | $15,000 | |
| Open | Clark Victor | $186,217 |
Source: Public Records
Tax History Compared to Growth
Tax History
| Year | Tax Paid | Tax Assessment Tax Assessment Total Assessment is a certain percentage of the fair market value that is determined by local assessors to be the total taxable value of land and additions on the property. | Land | Improvement |
|---|---|---|---|---|
| 2025 | $926 | $29,230 | $4,100 | $25,130 |
| 2024 | $1,026 | $29,230 | $4,100 | $25,130 |
| 2023 | $525 | $29,230 | $4,100 | $25,130 |
| 2022 | $905 | $17,340 | $2,700 | $14,640 |
| 2021 | $467 | $17,340 | $2,700 | $14,640 |
| 2020 | $466 | $17,340 | $2,700 | $14,640 |
| 2019 | $464 | $17,520 | $2,880 | $14,640 |
| 2018 | $451 | $17,520 | $2,880 | $14,640 |
| 2017 | $384 | $15,780 | $2,880 | $12,900 |
| 2016 | $384 | $15,780 | $2,880 | $12,900 |
| 2015 | $383 | $15,780 | $2,880 | $12,900 |
| 2014 | $382 | $15,780 | $2,880 | $12,900 |
Source: Public Records
Map
Nearby Homes
- 1321 Old Graphic St
- TBD (lot 29) Keystone Dr
- TBD (lot 30) Keystone Dr
- 2034 Mulberry Wire Rd
- 3042 Mulberry Highway 64 W
- TBD Duncan Rd
- 3032 King Dr
- 36 W 8th St
- 770 Church Ave
- 2150 Old Graphic St
- 3218 Mulberry Wire Rd
- TBD Exsorbet Dr
- 519 Church Ave
- 8 W 10th St
- TBD Industrial Park Dr
- 210 W 2nd St
- 101 Reynolds St
- 414 Carter Ave
- 10110 Booth Rd
- 3819 Ridgemont Estate
- TBD U S Highway 64
- 2130 U S Highway 64
- 1726 Mulberry Highway 64 W
- 1527 Mulberry Highway 64 W
- 905 N Gintown Rd
- 908 N Gin Town Rd
- 860 N Gintown Rd
- 1540 Mulberry Highway 64 W
- 1511 Mulberry Highway 64 W
- 850 N Gintown Rd
- 1026 Old Graphic St
- 1034 Old Graphic St
- 1829 Mulberry Highway 64 W
- 840 N Gintown Rd
- 833 N Gintown Rd
- 1050 Old Graphic St
- 1904 Mulberry Highway 64 W
- 1508 Mulberry Highway 64 W
- 1916 U S 64
- 1425 Mulberry Highway 64 W