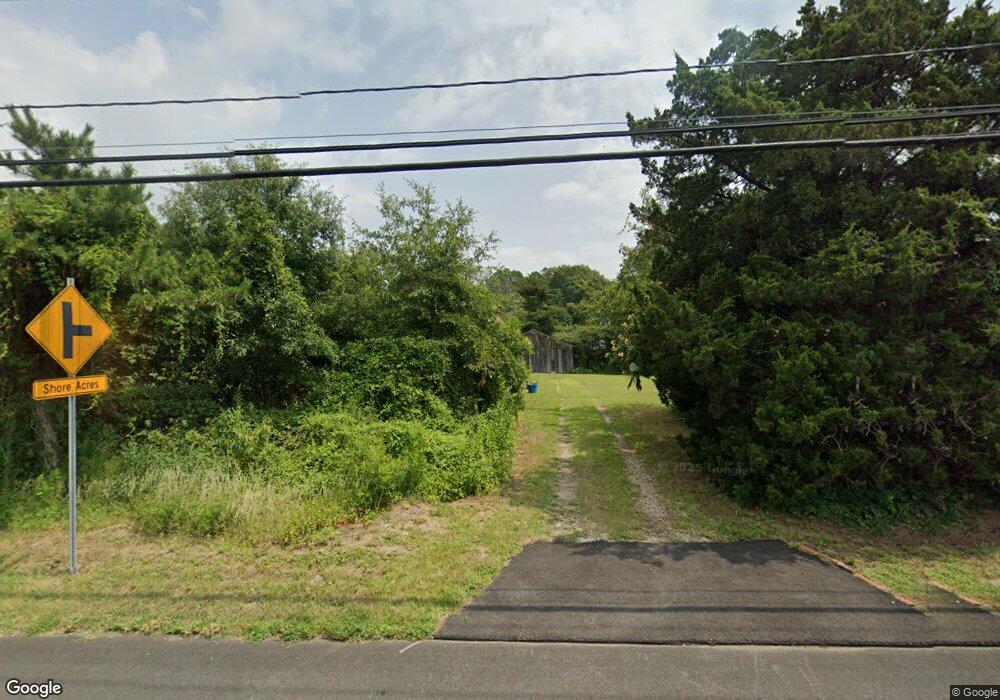
1633 Route 9 Ocean View, NJ 08230
Estimated Value: $347,000 - $391,000
2
Beds
1
Bath
924
Sq Ft
$400/Sq Ft
Est. Value
About This Home
This home is located at 1633 Route 9, Ocean View, NJ 08230 and is currently estimated at $369,265, approximately $399 per square foot. 1633 Route 9 is a home located in Cape May County with nearby schools including Upper Township Primary School, Upper Township Elementary School, and Upper Township Middle School.
Ownership History
Date
Name
Owned For
Owner Type
Purchase Details
Closed on
Oct 31, 2017
Sold by
Stroh Gerald
Bought by
Atlantic Cape Builders Llc
Current Estimated Value
Purchase Details
Closed on
Jun 17, 1999
Sold by
Fiorentino Frank
Bought by
Stroh Gerald
Purchase Details
Closed on
Feb 19, 1990
Sold by
Florentino Frank and Florentino Nancy
Bought by
Atlantic City Electric Co
Purchase Details
Closed on
Dec 14, 1988
Sold by
New Jersey Bell Tel Co
Bought by
New Jersey Bell Tel Co
Create a Home Valuation Report for This Property
The Home Valuation Report is an in-depth analysis detailing your home's value as well as a comparison with similar homes in the area
Home Values in the Area
Average Home Value in this Area
Purchase History
| Date | Buyer | Sale Price | Title Company |
|---|---|---|---|
| Atlantic Cape Builders Llc | $135,000 | Shore Title Agency Inc | |
| Stroh Gerald | $45,000 | -- | |
| Atlantic City Electric Co | -- | -- | |
| New Jersey Bell Tel Co | $2,000 | -- |
Source: Public Records
Tax History
| Year | Tax Paid | Tax Assessment Tax Assessment Total Assessment is a certain percentage of the fair market value that is determined by local assessors to be the total taxable value of land and additions on the property. | Land | Improvement |
|---|---|---|---|---|
| 2025 | $5,054 | $220,200 | $152,900 | $67,300 |
| 2024 | $5,054 | $220,200 | $152,900 | $67,300 |
| 2023 | $4,805 | $220,200 | $152,900 | $67,300 |
| 2022 | $4,644 | $220,200 | $152,900 | $67,300 |
| 2021 | $3,318 | $220,200 | $152,900 | $67,300 |
| 2020 | $4,312 | $220,200 | $152,900 | $67,300 |
| 2019 | $4,208 | $220,200 | $152,900 | $67,300 |
| 2018 | $4,100 | $220,200 | $152,900 | $67,300 |
| 2017 | $4,054 | $220,200 | $152,900 | $67,300 |
| 2016 | $3,841 | $205,400 | $152,900 | $52,500 |
| 2015 | $3,740 | $205,400 | $152,900 | $52,500 |
| 2014 | $3,863 | $259,800 | $194,800 | $65,000 |
Source: Public Records
Map
Nearby Homes
- 1729 Shore Rd
- 4 Sandcastle Dr
- 3 Sandcastle Dr
- 1731 Route 9 Unit 11
- 1731 Route 9 Unit 28
- 1731 Route 9 Unit 25
- 4 Prosit La
- 4 Prosit Ln
- 1431 Stagecoach Rd
- 23 Foxborough Rd
- 4 McDonald Dr
- 127 Route 50
- 40 Butter Rd
- 2 W Katherine Ave
- 4 W Katherine Ave
- 36 W Katherine Ave
- 86 Route 50
- 124 Butter Rd
- 10 New Jersey 50
- 2058 Route 9
Your Personal Tour Guide
Ask me questions while you tour the home.