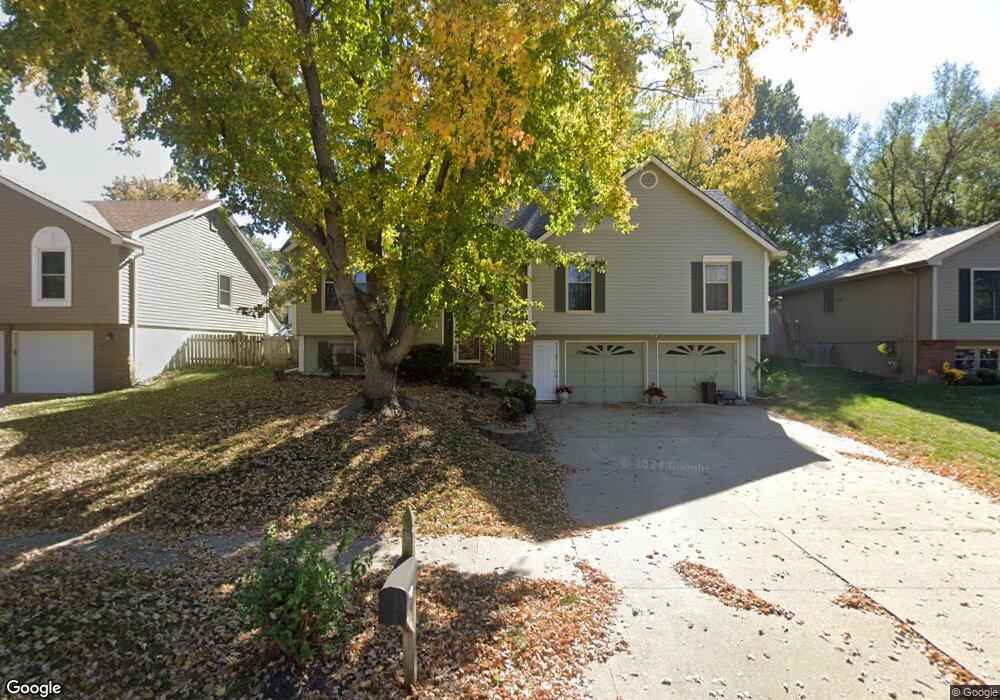
1633 Windsor Ln Liberty, MO 64068
Estimated Value: $355,000 - $386,000
3
Beds
3
Baths
1,498
Sq Ft
$248/Sq Ft
Est. Value
About This Home
This home is located at 1633 Windsor Ln, Liberty, MO 64068 and is currently estimated at $372,202, approximately $248 per square foot. 1633 Windsor Ln is a home located in Clay County with nearby schools including Alexander Doniphan Elementary School, Liberty Middle School, and Liberty High School.
Ownership History
Date
Name
Owned For
Owner Type
Purchase Details
Closed on
Jun 26, 2013
Sold by
Mckown Jeffrey S and Mckown Traci A
Bought by
Schmitt Brett E
Current Estimated Value
Home Financials for this Owner
Home Financials are based on the most recent Mortgage that was taken out on this home.
Original Mortgage
$160,550
Outstanding Balance
$114,846
Interest Rate
3.54%
Mortgage Type
New Conventional
Estimated Equity
$257,356
Purchase Details
Closed on
Sep 16, 2002
Sold by
Hessefort Arnold L and Hessefort Onnie M
Bought by
Mckown Jeffrey Scott and Mckown Traci A
Home Financials for this Owner
Home Financials are based on the most recent Mortgage that was taken out on this home.
Original Mortgage
$102,525
Interest Rate
6.26%
Mortgage Type
Purchase Money Mortgage
Purchase Details
Closed on
Oct 11, 2000
Sold by
Gray William F and Gray Linda R
Bought by
Hessefort Arnold L and Hessefort Onnie M
Create a Home Valuation Report for This Property
The Home Valuation Report is an in-depth analysis detailing your home's value as well as a comparison with similar homes in the area
Home Values in the Area
Average Home Value in this Area
Purchase History
| Date | Buyer | Sale Price | Title Company |
|---|---|---|---|
| Schmitt Brett E | -- | First Title Inc | |
| Mckown Jeffrey Scott | -- | Kansas City Title | |
| Hessefort Arnold L | -- | Thomson Title Corporation |
Source: Public Records
Mortgage History
| Date | Status | Borrower | Loan Amount |
|---|---|---|---|
| Open | Schmitt Brett E | $160,550 | |
| Previous Owner | Mckown Jeffrey Scott | $102,525 |
Source: Public Records
Tax History Compared to Growth
Tax History
| Year | Tax Paid | Tax Assessment Tax Assessment Total Assessment is a certain percentage of the fair market value that is determined by local assessors to be the total taxable value of land and additions on the property. | Land | Improvement |
|---|---|---|---|---|
| 2025 | $3,976 | $58,180 | -- | -- |
| 2024 | $3,976 | $51,700 | -- | -- |
| 2023 | $4,044 | $51,700 | $0 | $0 |
| 2022 | $3,453 | $43,590 | $0 | $0 |
| 2021 | $3,426 | $43,586 | $6,650 | $36,936 |
| 2020 | $2,923 | $34,920 | $0 | $0 |
| 2019 | $2,922 | $34,920 | $0 | $0 |
| 2018 | $2,711 | $31,810 | $0 | $0 |
| 2017 | $2,592 | $31,810 | $4,750 | $27,060 |
| 2016 | $2,592 | $30,700 | $4,750 | $25,950 |
| 2015 | $2,593 | $30,700 | $4,750 | $25,950 |
| 2014 | $2,503 | $29,410 | $4,370 | $25,040 |
Source: Public Records
Map
Nearby Homes
- 1323 Amesbury Ave
- 1218 Canterbury Ln
- 1507 Amesbury Ave
- 1124 Amesbury Ave
- 1537 Canterbury Ln
- 1105 Bristol Way
- 1733 Welleslay Ln
- 1304 Wellington Way
- 1327 Easton Ct
- 918 Amesbury Ave
- 1331 Park Ln
- 862 Amesbury Ave
- 1317 Park Ln
- 415 Monterey Ave
- 509 Belmont St
- 420 Belmont St
- 716 Bristol Ct
- 1209 Liberty Drive Terrace
- 124 Johnson Rd
- 1856 Arbor Trail
- 1701 Windsor Ln
- 1629 Windsor Ln
- 1700 Tudor Ln
- 1705 Windsor Ln
- 1625 Windsor Ln
- 1628 Tudor Ln
- 1704 Tudor Ln
- 1626 Windsor Ln
- 1708 Tudor Ln
- 1624 Tudor Ln
- 1702 Windsor Ln
- 1709 Windsor Ln
- 1621 Windsor Ln
- 1622 Windsor Ln
- 1620 Tudor Ln
- 1712 Tudor Ln
- 1706 Windsor Ln
- 1713 Windsor Ln
- 1617 Windsor Ln
- 1311 Bristol Way