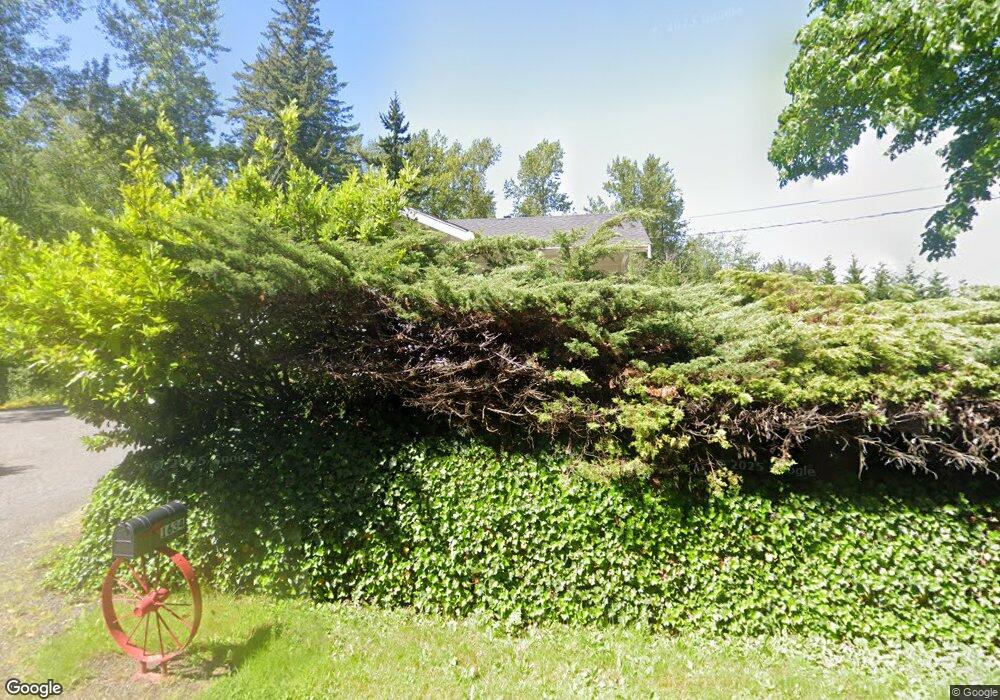
1634 Kelly Rd Bellingham, WA 98226
Estimated Value: $539,795 - $648,000
2
Beds
1
Bath
1,035
Sq Ft
$571/Sq Ft
Est. Value
About This Home
This home is located at 1634 Kelly Rd, Bellingham, WA 98226 and is currently estimated at $590,949, approximately $570 per square foot. 1634 Kelly Rd is a home located in Whatcom County with nearby schools including Mount Baker Senior High School.
Ownership History
Date
Name
Owned For
Owner Type
Purchase Details
Closed on
Jul 23, 2020
Sold by
Mcgee Luke M and Mcgee Emily K
Bought by
Macswan Brian Thomas and Macswan Sjana Christine
Current Estimated Value
Home Financials for this Owner
Home Financials are based on the most recent Mortgage that was taken out on this home.
Original Mortgage
$404,040
Outstanding Balance
$358,276
Interest Rate
3.1%
Mortgage Type
New Conventional
Estimated Equity
$232,673
Purchase Details
Closed on
Dec 10, 2010
Sold by
Lovell Kathleen L
Bought by
Mcgee Luke M and Mcgee Emily K
Home Financials for this Owner
Home Financials are based on the most recent Mortgage that was taken out on this home.
Original Mortgage
$328,500
Interest Rate
4.21%
Mortgage Type
New Conventional
Purchase Details
Closed on
Jan 27, 2009
Sold by
Lovell Kathleen L
Bought by
Lovell Kathleen L and Lovell Terry H
Create a Home Valuation Report for This Property
The Home Valuation Report is an in-depth analysis detailing your home's value as well as a comparison with similar homes in the area
Home Values in the Area
Average Home Value in this Area
Purchase History
| Date | Buyer | Sale Price | Title Company |
|---|---|---|---|
| Macswan Brian Thomas | $400,000 | Chicago Title Bellingham | |
| Mcgee Luke M | $365,280 | Stewart Title Company | |
| Lovell Kathleen L | -- | None Available |
Source: Public Records
Mortgage History
| Date | Status | Borrower | Loan Amount |
|---|---|---|---|
| Open | Macswan Brian Thomas | $404,040 | |
| Previous Owner | Mcgee Luke M | $328,500 |
Source: Public Records
Tax History Compared to Growth
Tax History
| Year | Tax Paid | Tax Assessment Tax Assessment Total Assessment is a certain percentage of the fair market value that is determined by local assessors to be the total taxable value of land and additions on the property. | Land | Improvement |
|---|---|---|---|---|
| 2024 | $3,486 | $521,728 | $257,230 | $264,498 |
| 2023 | $3,486 | $480,724 | $231,165 | $249,559 |
| 2022 | $2,911 | $394,027 | $189,475 | $204,552 |
| 2021 | $2,738 | $317,761 | $152,801 | $164,960 |
| 2020 | $2,530 | $269,288 | $129,492 | $139,796 |
| 2019 | $2,257 | $237,263 | $114,092 | $123,171 |
| 2018 | $2,983 | $228,753 | $110,000 | $118,753 |
| 2017 | -- | $236,412 | $126,720 | $109,692 |
Source: Public Records
Map
Nearby Homes
- 0 xxxx Kelly Rd
- 5180 Penny Ln
- 1321 E Smith Rd
- 0 van Wyck Ln
- 2571 E Smith Rd
- 4645 Vining Rd
- 4455 E 18th Crest
- 1041 Sterk Ln
- 5539 Noon Rd
- 1445 Mt Baker Hwy
- 4220 Brays Way
- 1758 Emerald Lake Way
- 1668 Sapphire Trail
- 4269 Dewey Rd
- 4136 Malachite Dr
- 4121 Malachite Dr
- 1 XXX Sleepy Hollow Ln
- 3827 Keystone Way
- 2200 E Smith Rd
- 1812 Squalicum Mountain Rd