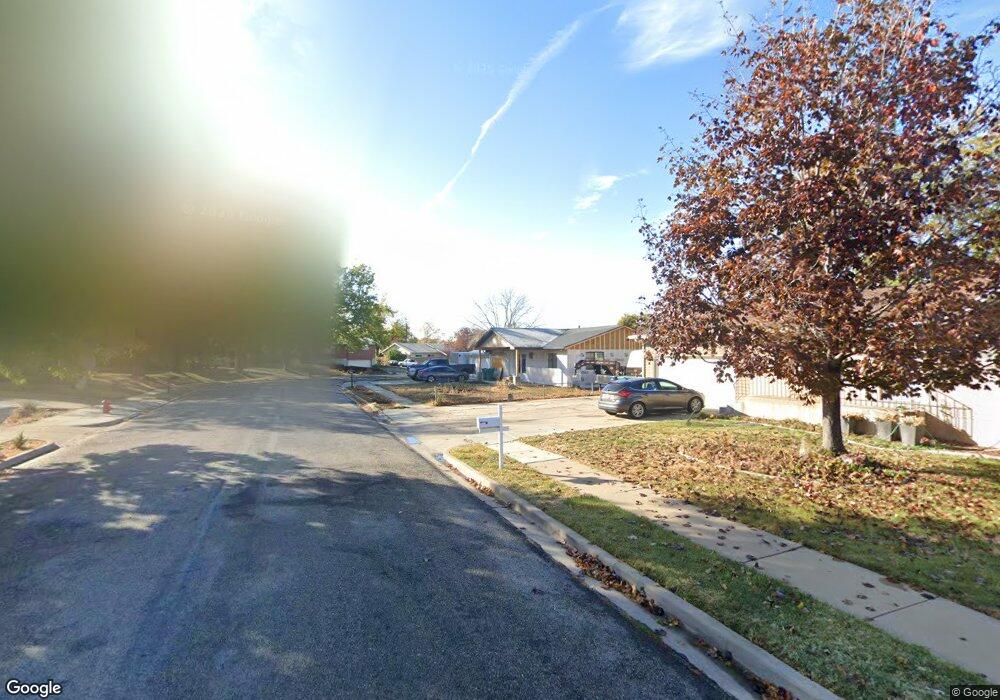
1634 N 725 W Clearfield, UT 84015
Estimated Value: $409,000 - $446,000
4
Beds
2
Baths
1,488
Sq Ft
$288/Sq Ft
Est. Value
About This Home
This home is located at 1634 N 725 W, Clearfield, UT 84015 and is currently estimated at $428,081, approximately $287 per square foot. 1634 N 725 W is a home located in Davis County with nearby schools including Clinton Elementary School, Sunset Junior High School, and Clearfield High School.
Ownership History
Date
Name
Owned For
Owner Type
Purchase Details
Closed on
Nov 4, 2019
Sold by
Torres Andrew Paul and Torres Raquel Roskelley
Bought by
Roskelley Bracken Brett
Current Estimated Value
Home Financials for this Owner
Home Financials are based on the most recent Mortgage that was taken out on this home.
Original Mortgage
$257,050
Outstanding Balance
$226,586
Interest Rate
3.7%
Mortgage Type
New Conventional
Estimated Equity
$201,495
Purchase Details
Closed on
Nov 1, 2017
Sold by
Ostler Cody and Ostler Teresa
Bought by
Torres Andrew Paul and Torres Raquel Roskelley
Home Financials for this Owner
Home Financials are based on the most recent Mortgage that was taken out on this home.
Original Mortgage
$158,800
Interest Rate
3.83%
Mortgage Type
New Conventional
Purchase Details
Closed on
Feb 4, 2000
Sold by
Mark Higley Construction Lc
Bought by
Strange Jason P and Strange Stacy M
Home Financials for this Owner
Home Financials are based on the most recent Mortgage that was taken out on this home.
Original Mortgage
$125,465
Interest Rate
7.96%
Mortgage Type
FHA
Create a Home Valuation Report for This Property
The Home Valuation Report is an in-depth analysis detailing your home's value as well as a comparison with similar homes in the area
Home Values in the Area
Average Home Value in this Area
Purchase History
| Date | Buyer | Sale Price | Title Company |
|---|---|---|---|
| Roskelley Bracken Brett | -- | Metro National Title | |
| Torres Andrew Paul | -- | Mountain View Title | |
| Strange Jason P | -- | Heritage West Title Insuranc |
Source: Public Records
Mortgage History
| Date | Status | Borrower | Loan Amount |
|---|---|---|---|
| Open | Roskelley Bracken Brett | $257,050 | |
| Previous Owner | Torres Andrew Paul | $158,800 | |
| Previous Owner | Strange Jason P | $125,465 |
Source: Public Records
Tax History Compared to Growth
Tax History
| Year | Tax Paid | Tax Assessment Tax Assessment Total Assessment is a certain percentage of the fair market value that is determined by local assessors to be the total taxable value of land and additions on the property. | Land | Improvement |
|---|---|---|---|---|
| 2025 | $2,156 | $207,350 | $86,993 | $120,357 |
| 2024 | $2,077 | $200,750 | $95,964 | $104,786 |
| 2023 | $1,996 | $357,000 | $108,586 | $248,414 |
| 2022 | $2,124 | $210,100 | $67,156 | $142,944 |
| 2021 | $1,955 | $287,000 | $82,833 | $204,167 |
| 2020 | $1,701 | $247,000 | $69,736 | $177,264 |
| 2019 | $1,656 | $235,000 | $82,697 | $152,303 |
| 2018 | $1,521 | $212,000 | $70,008 | $141,992 |
| 2016 | $1,095 | $78,815 | $27,124 | $51,691 |
| 2015 | $1,340 | $91,740 | $27,124 | $64,616 |
| 2014 | $1,216 | $84,575 | $27,124 | $57,451 |
| 2013 | -- | $82,432 | $27,143 | $55,289 |
Source: Public Records
Map
Nearby Homes