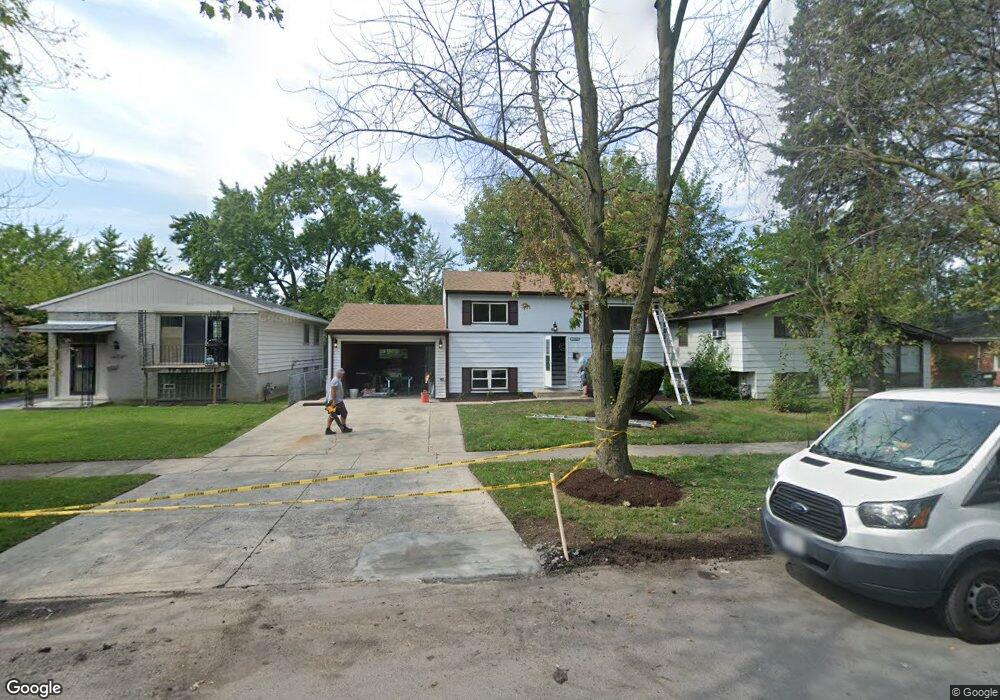
16342 Marshfield Ave Markham, IL 60428
Estimated Value: $112,000 - $172,000
4
Beds
2
Baths
780
Sq Ft
$182/Sq Ft
Est. Value
About This Home
This home is located at 16342 Marshfield Ave, Markham, IL 60428 and is currently estimated at $141,759, approximately $181 per square foot. 16342 Marshfield Ave is a home located in Cook County with nearby schools including Thornwood High School.
Ownership History
Date
Name
Owned For
Owner Type
Purchase Details
Closed on
Oct 31, 2022
Sold by
Klu Homes Llc
Bought by
Jenkins Yvonne
Current Estimated Value
Home Financials for this Owner
Home Financials are based on the most recent Mortgage that was taken out on this home.
Original Mortgage
$184,775
Outstanding Balance
$178,282
Interest Rate
6.94%
Mortgage Type
New Conventional
Estimated Equity
-$36,523
Purchase Details
Closed on
Feb 3, 2022
Sold by
Jth Real Estate Llc
Bought by
Klu Homes Llc
Purchase Details
Closed on
Jan 25, 2022
Sold by
Jth Real Estate Llc
Bought by
Klu Homes Llc
Purchase Details
Closed on
Sep 30, 2017
Sold by
Reidy Jud
Bought by
Jth Real Estate Llc
Purchase Details
Closed on
May 16, 2012
Sold by
Federal Home Loan Mortgage Corporation
Bought by
Reidy Jud
Purchase Details
Closed on
Jan 24, 2012
Sold by
Kuntz J Mark
Bought by
Federal Home Loan Mortgage Corporation
Purchase Details
Closed on
Apr 15, 2009
Sold by
Truok Properties Vi Llc
Bought by
First Community Bank & Trust and Trust #2009-0356
Purchase Details
Closed on
Sep 15, 2003
Sold by
Wachovia Bank Na
Bought by
Kuntz J Mark
Purchase Details
Closed on
Jun 6, 2003
Sold by
Williams Patricia
Bought by
Wachovia Bank Na and Amortizing Residential Collateral Trust
Create a Home Valuation Report for This Property
The Home Valuation Report is an in-depth analysis detailing your home's value as well as a comparison with similar homes in the area
Home Values in the Area
Average Home Value in this Area
Purchase History
| Date | Buyer | Sale Price | Title Company |
|---|---|---|---|
| Jenkins Yvonne | $194,500 | None Listed On Document | |
| Klu Homes Llc | -- | -- | |
| Klu Homes Llc | -- | -- | |
| Jth Real Estate Llc | -- | Attorney | |
| Reidy Jud | $23,000 | Attorneys Title Guaranty Fun | |
| Federal Home Loan Mortgage Corporation | -- | None Available | |
| First Community Bank & Trust | -- | None Available | |
| Truok Properties Vi Llc | -- | None Available | |
| Kuntz J Mark | $55,000 | Premier Title | |
| Wachovia Bank Na | -- | -- | |
| Wachovia Bank Na | -- | -- |
Source: Public Records
Mortgage History
| Date | Status | Borrower | Loan Amount |
|---|---|---|---|
| Open | Jenkins Yvonne | $184,775 |
Source: Public Records
Tax History
| Year | Tax Paid | Tax Assessment Tax Assessment Total Assessment is a certain percentage of the fair market value that is determined by local assessors to be the total taxable value of land and additions on the property. | Land | Improvement |
|---|---|---|---|---|
| 2025 | $2,713 | $3,844 | $1,287 | $2,557 |
| 2024 | $2,713 | $3,844 | $1,287 | $2,557 |
| 2023 | $2,181 | $3,844 | $1,287 | $2,557 |
| 2022 | $2,181 | $2,301 | $1,089 | $1,212 |
| 2021 | $2,129 | $2,300 | $1,089 | $1,211 |
| 2020 | $2,048 | $2,300 | $1,089 | $1,211 |
| 2019 | $1,856 | $2,183 | $990 | $1,193 |
| 2018 | $1,804 | $2,184 | $990 | $1,194 |
| 2017 | $1,760 | $2,184 | $990 | $1,194 |
| 2016 | $2,023 | $2,611 | $891 | $1,720 |
| 2015 | $1,895 | $2,611 | $891 | $1,720 |
| 2014 | $2,424 | $3,309 | $891 | $2,418 |
| 2013 | $1,752 | $2,552 | $891 | $1,661 |
Source: Public Records
Map
Nearby Homes
- 16423 Marshfield Ave
- 16424 Ashland Ave
- 1716 W 163rd St
- 16454 Paulina St
- 16229 Marshfield Ave
- 16226 Ashland Ave
- 16511 Paulina St
- 16412 Wood St
- 16527 Marshfield Ave
- 16259 Laflin Ave
- 16207 Justine St
- 16547 Paulina St
- 1848 W 163rd St
- 16131 Hermitage Ave
- 16460 Honore Ave
- 16130 Justine St
- 16611 Marshfield Ave
- 16637 Paulina St
- 16601 Honore Ave
- 16641 Paulina St
- 16342 Marshfield Ave
- 16342 S Marshfield Ave
- 16338 Marshfield Ave
- 16348 Marshfield Ave
- 16334 Marshfield Ave
- 16354 Marshfield Ave
- 16328 Marshfield Ave
- 16358 Marshfield Ave
- 16341 Paulina St
- 16345 Marshfield Ave
- 16345 Paulina St
- 16339 Marshfield Ave
- 16349 Marshfield Ave
- 16335 Paulina St
- 16351 Paulina St
- 16326 Marshfield Ave
- 16353 Marshfield Ave
- 16331 Paulina St
- 16357 Paulina St
- 16331 Marshfield Ave
Your Personal Tour Guide
Ask me questions while you tour the home.