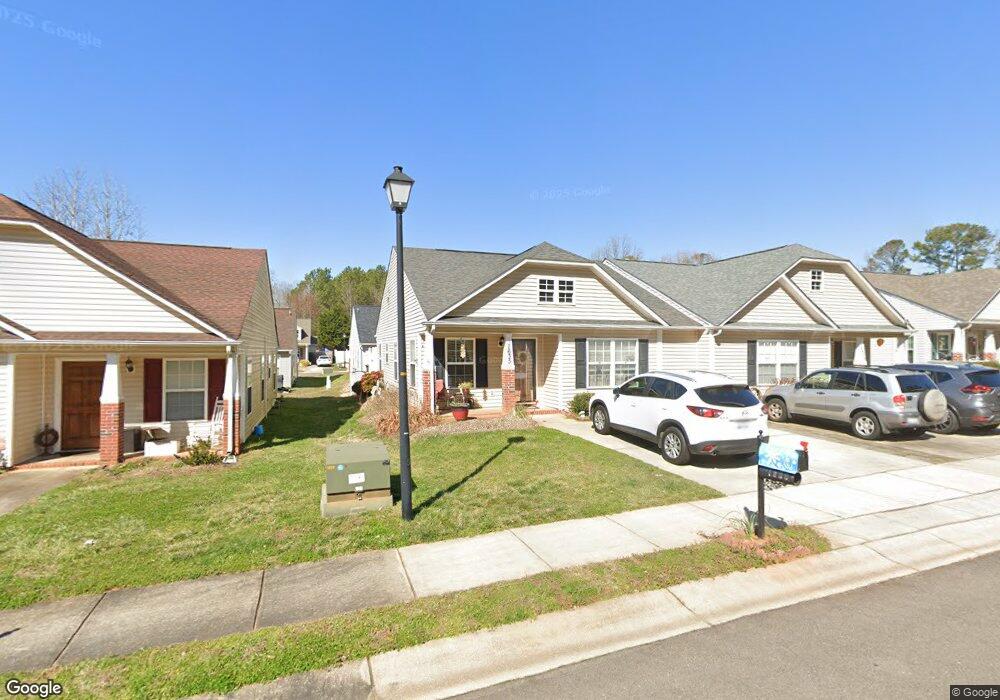
1635 Clemmon Sanders Cir Unit 29A Rock Hill, SC 29732
Estimated Value: $229,000 - $264,000
3
Beds
2
Baths
1,080
Sq Ft
$227/Sq Ft
Est. Value
About This Home
This home is located at 1635 Clemmon Sanders Cir Unit 29A, Rock Hill, SC 29732 and is currently estimated at $245,621, approximately $227 per square foot. 1635 Clemmon Sanders Cir Unit 29A is a home located in York County with nearby schools including York Road Elementary School, Rawlinson Road Middle School, and Northwestern High School.
Ownership History
Date
Name
Owned For
Owner Type
Purchase Details
Closed on
Oct 27, 2015
Sold by
Estate Of Karen M Loflin
Bought by
Barnhill Patrick D
Current Estimated Value
Home Financials for this Owner
Home Financials are based on the most recent Mortgage that was taken out on this home.
Original Mortgage
$50,000
Outstanding Balance
$39,461
Interest Rate
3.89%
Mortgage Type
New Conventional
Estimated Equity
$206,161
Purchase Details
Closed on
Dec 28, 2011
Sold by
Armstrong Gene F and Armstrong Dorian K
Bought by
Loflin Karne M
Home Financials for this Owner
Home Financials are based on the most recent Mortgage that was taken out on this home.
Original Mortgage
$100,250
Interest Rate
4.06%
Mortgage Type
New Conventional
Purchase Details
Closed on
Sep 25, 2007
Sold by
Infinity Designs Inc
Bought by
Armstrong Gene F and Armstrong Dorian K
Purchase Details
Closed on
Apr 27, 2007
Sold by
Newcort Llc
Bought by
Infinity Designs Inc
Create a Home Valuation Report for This Property
The Home Valuation Report is an in-depth analysis detailing your home's value as well as a comparison with similar homes in the area
Home Values in the Area
Average Home Value in this Area
Purchase History
| Date | Buyer | Sale Price | Title Company |
|---|---|---|---|
| Barnhill Patrick D | $118,700 | -- | |
| Loflin Karne M | $105,900 | -- | |
| Armstrong Gene F | $109,900 | Attorney | |
| Infinity Designs Inc | $40,000 | None Available |
Source: Public Records
Mortgage History
| Date | Status | Borrower | Loan Amount |
|---|---|---|---|
| Open | Barnhill Patrick D | $50,000 | |
| Previous Owner | Loflin Karne M | $100,250 |
Source: Public Records
Tax History Compared to Growth
Tax History
| Year | Tax Paid | Tax Assessment Tax Assessment Total Assessment is a certain percentage of the fair market value that is determined by local assessors to be the total taxable value of land and additions on the property. | Land | Improvement |
|---|---|---|---|---|
| 2024 | $1,011 | $4,609 | $800 | $3,809 |
| 2023 | $1,014 | $4,609 | $800 | $3,809 |
| 2022 | $1,021 | $4,609 | $800 | $3,809 |
| 2021 | -- | $4,609 | $800 | $3,809 |
| 2020 | $1,023 | $4,609 | $0 | $0 |
| 2019 | $1,053 | $4,600 | $0 | $0 |
| 2018 | $1,052 | $4,600 | $0 | $0 |
| 2017 | $1,013 | $4,600 | $0 | $0 |
| 2016 | $1,004 | $4,600 | $0 | $0 |
| 2014 | $474 | $4,100 | $800 | $3,300 |
| 2013 | $474 | $4,120 | $800 | $3,320 |
Source: Public Records
Map
Nearby Homes
- 1581 Huntmoor Dr
- 720 Herlong Ave
- 1625 Begonia Way
- 1650 W Main St
- 1609 Begonia Way
- 1545 Patio Point
- 1540 Coatsworth Ln
- 926 Meadow Lakes Rd
- 637 Tysons Forest Dr
- 1750 Trellis Dr
- 1269 Longview Rd
- 1085 Pinecrest Dr
- 1581 Bluff Ct
- 1391 Colwick Ln
- 1627 Jonesberry Dr
- 1441 Spring View Ct
- 418 Tysons Forest Dr
- 2085 Cavendale Dr
- 851 Gist Rd
- 1821 Huntington Place
- 1635 Clemmon Sanders Cir
- 1639 Clemmon Sanders Cir Unit 29B
- 1631 Clemmon Sanders Cir
- 1643 Clemmon Sanders Cir
- 1699 Clemmon Sanders Cir
- 1695 Clemmon Sanders Cir
- 1703 Clemmon Sanders Cir Unit 23 A
- 1627 Clemmon Sanders Cir
- 1691 Clemmon Sanders Cir
- 1707 Clemmon Sanders Cir Unit 23 B
- 1647 Clemmon Sanders Cir
- 1623 Clemmon Sanders Cir
- 1687 Clemmon Sanders Cir
- 1711 Clemmon Sanders Cir
- 1711 Clemmon Sanders Cir Unit 24
- 1651 Clemmon Sanders Cir Unit 1651
- 1619 Clemmon Sanders Cir
- 1683 Clemmon Sanders Cir
- 1715 Clemmon Sanders Cir
- 1622 Clemmon Sanders Cir