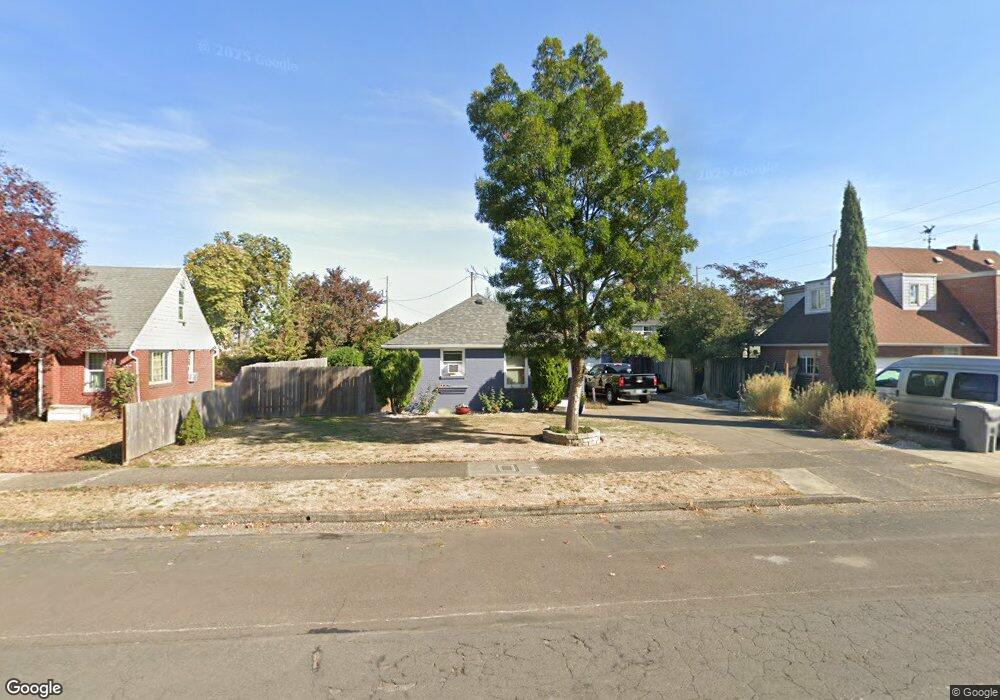
1635 Maple St SW Albany, OR 97321
Central Albany NeighborhoodEstimated Value: $314,191 - $327,000
2
Beds
1
Bath
848
Sq Ft
$378/Sq Ft
Est. Value
About This Home
This home is located at 1635 Maple St SW, Albany, OR 97321 and is currently estimated at $320,596, approximately $378 per square foot. 1635 Maple St SW is a home located in Linn County with nearby schools including Central Elementary School, Takena Elementary School, and Memorial Middle School.
Ownership History
Date
Name
Owned For
Owner Type
Purchase Details
Closed on
Dec 13, 2010
Sold by
Pacific Northwest Investments Llc
Bought by
Emuobome Kathy A
Current Estimated Value
Home Financials for this Owner
Home Financials are based on the most recent Mortgage that was taken out on this home.
Original Mortgage
$108,538
Outstanding Balance
$71,539
Interest Rate
4.25%
Mortgage Type
FHA
Estimated Equity
$249,057
Purchase Details
Closed on
Aug 27, 2010
Sold by
Lamaison Taryn Rae
Bought by
Pacific Northwest Investments Llc
Home Financials for this Owner
Home Financials are based on the most recent Mortgage that was taken out on this home.
Original Mortgage
$80,000
Interest Rate
4.52%
Mortgage Type
Purchase Money Mortgage
Purchase Details
Closed on
Aug 2, 2004
Sold by
Carter Robby D
Bought by
Lamalson Taryn Rae
Home Financials for this Owner
Home Financials are based on the most recent Mortgage that was taken out on this home.
Original Mortgage
$74,400
Interest Rate
6.24%
Mortgage Type
New Conventional
Create a Home Valuation Report for This Property
The Home Valuation Report is an in-depth analysis detailing your home's value as well as a comparison with similar homes in the area
Home Values in the Area
Average Home Value in this Area
Purchase History
| Date | Buyer | Sale Price | Title Company |
|---|---|---|---|
| Emuobome Kathy A | $110,000 | Ticor Title | |
| Pacific Northwest Investments Llc | $60,000 | Ticor Title | |
| Lamalson Taryn Rae | $93,000 | First American Title |
Source: Public Records
Mortgage History
| Date | Status | Borrower | Loan Amount |
|---|---|---|---|
| Open | Emuobome Kathy A | $108,538 | |
| Previous Owner | Pacific Northwest Investments Llc | $80,000 | |
| Previous Owner | Lamalson Taryn Rae | $74,400 | |
| Closed | Lamalson Taryn Rae | $18,600 |
Source: Public Records
Tax History
| Year | Tax Paid | Tax Assessment Tax Assessment Total Assessment is a certain percentage of the fair market value that is determined by local assessors to be the total taxable value of land and additions on the property. | Land | Improvement |
|---|---|---|---|---|
| 2025 | $2,755 | $138,430 | -- | -- |
| 2024 | $2,675 | $134,400 | -- | -- |
| 2023 | $2,599 | $130,490 | $0 | $0 |
| 2022 | $2,558 | $126,690 | $0 | $0 |
| 2021 | $2,407 | $123,000 | $0 | $0 |
| 2020 | $2,375 | $119,420 | $0 | $0 |
| 2019 | $2,320 | $115,950 | $0 | $0 |
| 2018 | $2,260 | $112,580 | $0 | $0 |
| 2017 | $2,194 | $109,310 | $0 | $0 |
| 2016 | $1,941 | $106,130 | $0 | $0 |
Source: Public Records
Map
Nearby Homes
- 1530 Maple St SW
- 1450 Walnut St SW
- 520 Pacific Blvd SW
- 700 14th Ave SW
- 515 SW Queen Ave
- 1425 Calapooia St SW
- 1229 Washington St SW
- 1098 13th Ave SW
- Lot 2 SW 12th Ave
- 1530 Takena St SW
- 2240 Ferry St SW
- 1105 25th Ave SW
- 1420 Park Terrace SW
- 1215 10th Ave SW
- 1303 10th Ave SW
- 1160 24th Ave SW
- 718 Washington St SW
- 1075 8th Ave SW
- 1840 Lyon St SW
- 1620 16th Ave SW
- 1625 Maple St SW
- 1665 Maple St SW
- 745 Queen Ave SW
- 735 Queen Ave SW
- 1605 Maple St SW
- 1640 Vine St SW
- 724 16th Ave SW
- 1630 Vine St SW
- 725 Queen Ave SW
- 1620 Maple St SW
- 714 16th Ave SW
- 1610 Maple St SW
- 805 Queen Ave SW
- 705 Queen Ave SW
- 800 16th Ave SW
- 704 16th Ave SW
- 777 18th Ave SW
- 745 16th Ave SW
- 810 Queen Ave SW
- 815 16th Ave SW
Your Personal Tour Guide
Ask me questions while you tour the home.