
$1,900
- 1 Bath
- 683 Sq Ft
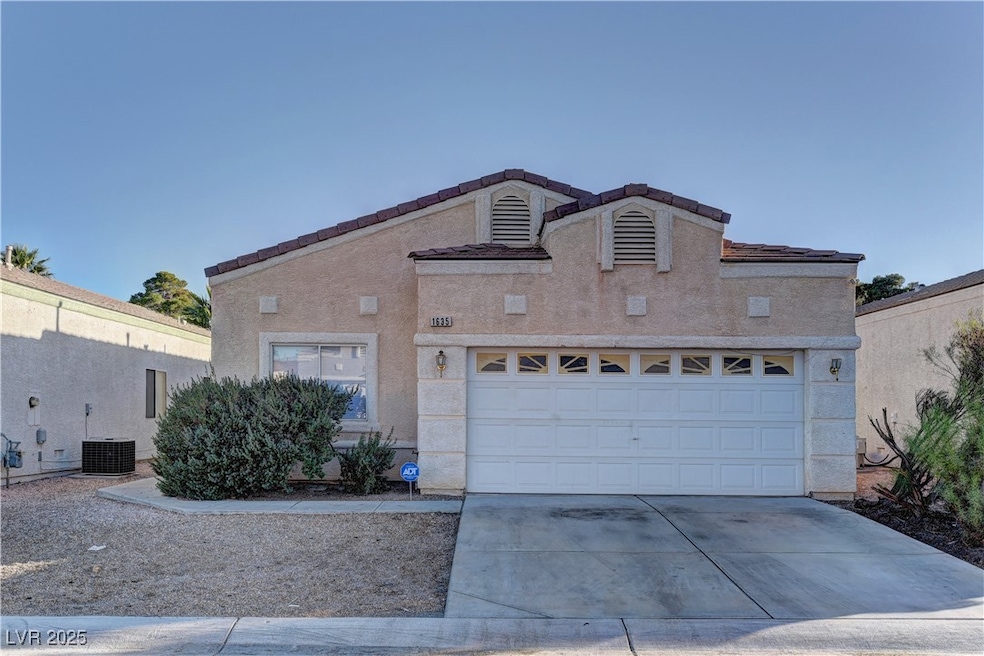
- 353 E Bonneville Ave
- Unit 727
- Las Vegas, NV
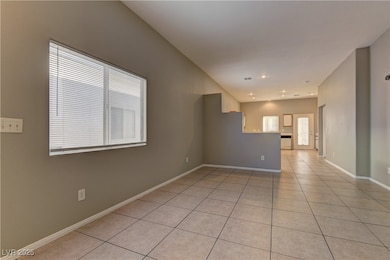
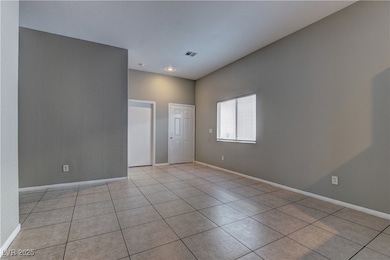
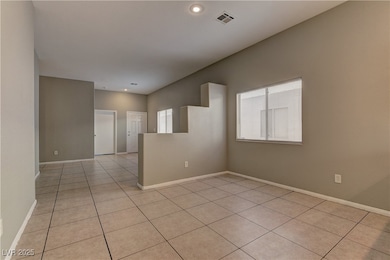
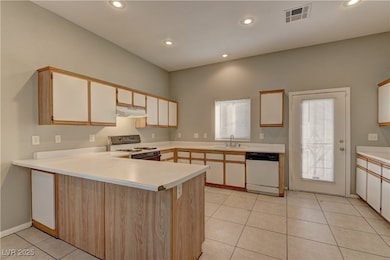
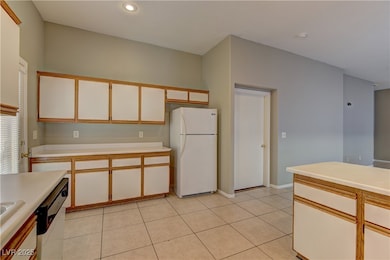
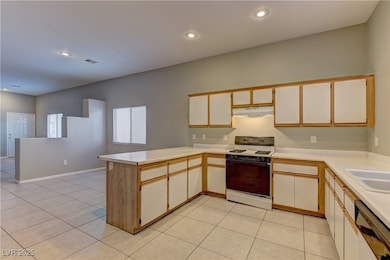
Base rent is $1900. Location, location, location! Welcome to your fully furnished efficiency studio in the heart of Downtown Las Vegas. Short distance to Fremont Street, the Arts District, restaurants, and the Juhl promenade. Features include a California king bed, a large sofa for guests, granite countertops, stainless steel appliances, and wood-like tile flooring for easy care. Smart TV with
Dale Jones RE/MAX Legacy