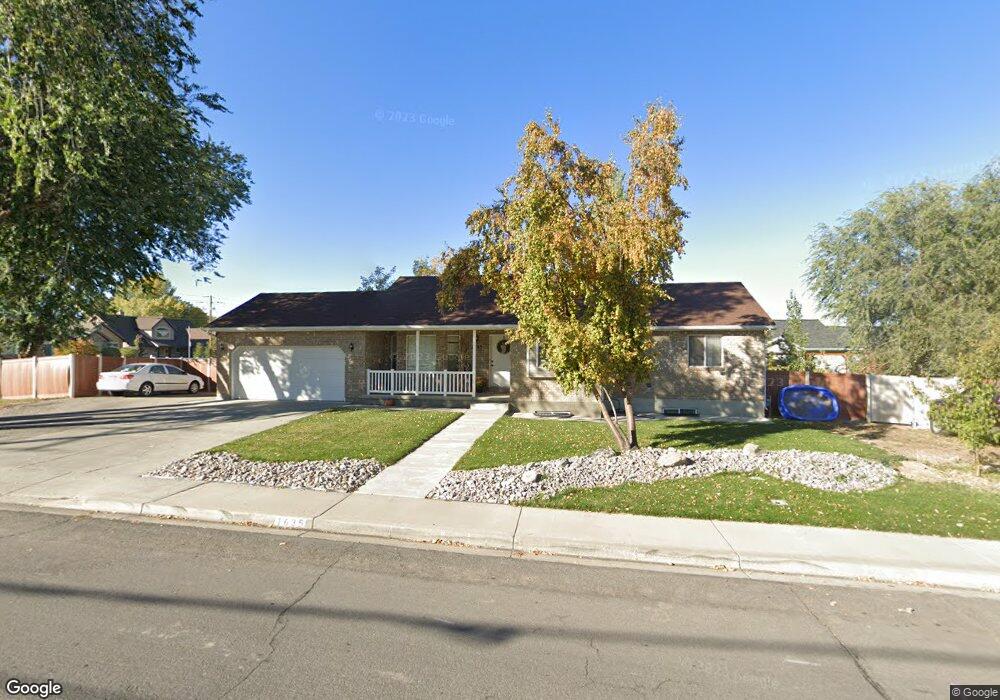
1635 N 1600 W Mapleton, UT 84664
Estimated Value: $585,275 - $791,000
6
Beds
3
Baths
2,645
Sq Ft
$246/Sq Ft
Est. Value
About This Home
This home is located at 1635 N 1600 W, Mapleton, UT 84664 and is currently estimated at $651,319, approximately $246 per square foot. 1635 N 1600 W is a home located in Utah County with nearby schools including Mapleton School, Mapleton Junior High School, and Maple Mountain High School.
Ownership History
Date
Name
Owned For
Owner Type
Purchase Details
Closed on
Aug 17, 2020
Sold by
Wilkins R Brian R and Wilkins Lorie
Bought by
Aubrey Elijah M and Aubrey Kaitlin
Current Estimated Value
Home Financials for this Owner
Home Financials are based on the most recent Mortgage that was taken out on this home.
Original Mortgage
$428,740
Outstanding Balance
$380,323
Interest Rate
3%
Mortgage Type
New Conventional
Estimated Equity
$270,997
Purchase Details
Closed on
Oct 5, 2000
Sold by
Wilkins R Brian
Bought by
Wilkins R Brian and Wilkins Lorie
Home Financials for this Owner
Home Financials are based on the most recent Mortgage that was taken out on this home.
Original Mortgage
$189,150
Interest Rate
8.01%
Create a Home Valuation Report for This Property
The Home Valuation Report is an in-depth analysis detailing your home's value as well as a comparison with similar homes in the area
Home Values in the Area
Average Home Value in this Area
Purchase History
| Date | Buyer | Sale Price | Title Company |
|---|---|---|---|
| Aubrey Elijah M | -- | Real Advantage Ttl Ins Agcy | |
| Wilkins R Brian | -- | Pro Title & Escrow Inc | |
| Wilkins R Brian | -- | Pro Title & Escrow Inc |
Source: Public Records
Mortgage History
| Date | Status | Borrower | Loan Amount |
|---|---|---|---|
| Open | Aubrey Elijah M | $428,740 | |
| Previous Owner | Wilkins R Brian | $189,150 |
Source: Public Records
Tax History
| Year | Tax Paid | Tax Assessment Tax Assessment Total Assessment is a certain percentage of the fair market value that is determined by local assessors to be the total taxable value of land and additions on the property. | Land | Improvement |
|---|---|---|---|---|
| 2025 | $2,913 | $306,460 | -- | -- |
| 2024 | $2,913 | $285,340 | $0 | $0 |
| 2023 | $3,018 | $297,495 | $0 | $0 |
| 2022 | $3,294 | $321,090 | $0 | $0 |
| 2021 | $2,744 | $410,600 | $166,700 | $243,900 |
| 2020 | $2,704 | $391,400 | $147,500 | $243,900 |
| 2019 | $2,466 | $364,400 | $141,600 | $222,800 |
| 2018 | $2,248 | $316,200 | $119,200 | $197,000 |
| 2017 | $2,086 | $155,705 | $0 | $0 |
| 2016 | $2,043 | $151,580 | $0 | $0 |
| 2015 | $1,893 | $139,590 | $0 | $0 |
| 2014 | $1,740 | $126,005 | $0 | $0 |
Source: Public Records
Map
Nearby Homes
- 1518 S 600 E
- 1403 S 625 E
- 1525 S 400 E Unit 36
- 1410 W 1200 N
- 1121 W 1800 N
- 1853 S 375 E
- 1836 W 800 N
- 405 W 1200 N Unit 4
- 487 W 1200 N Unit 1
- 1896 W 800 N
- 281 Winchester Dr
- 1632 S Main St
- 683 N Heritage St
- 657 N Heritage St Unit 9
- 641 N Heritage St Unit 8
- 599 N Heritage St Unit 6
- 1512 W 600 N Unit 4
- 581 N Heritage St Unit 5
- 1446 W 600 N Unit 5
- 2128 Bridger Dr
- 1630 N 1650 W
- 1630 N 1600 W
- 1691 N 1600 W
- 1660 N 1600 W
- 1605 W 1600 N
- 1629 W 1600 N
- 1802 W 1600 N Unit 4
- 1804 W 1600 N
- 1806 W 1600 N
- 1811 W 1600 N Unit 11
- 1814 W 1600 N
- 1824 W 1600 N Unit 24
- 1704 N 1600 W
- 1625 N 1650 W
- 1595 W 1600 N
- 1700 N 1650 W
- 1665 N 1650 W
- 1729 N 1600 W
- 1510 W 1600 N
- 1651 W 1600 N
Your Personal Tour Guide
Ask me questions while you tour the home.