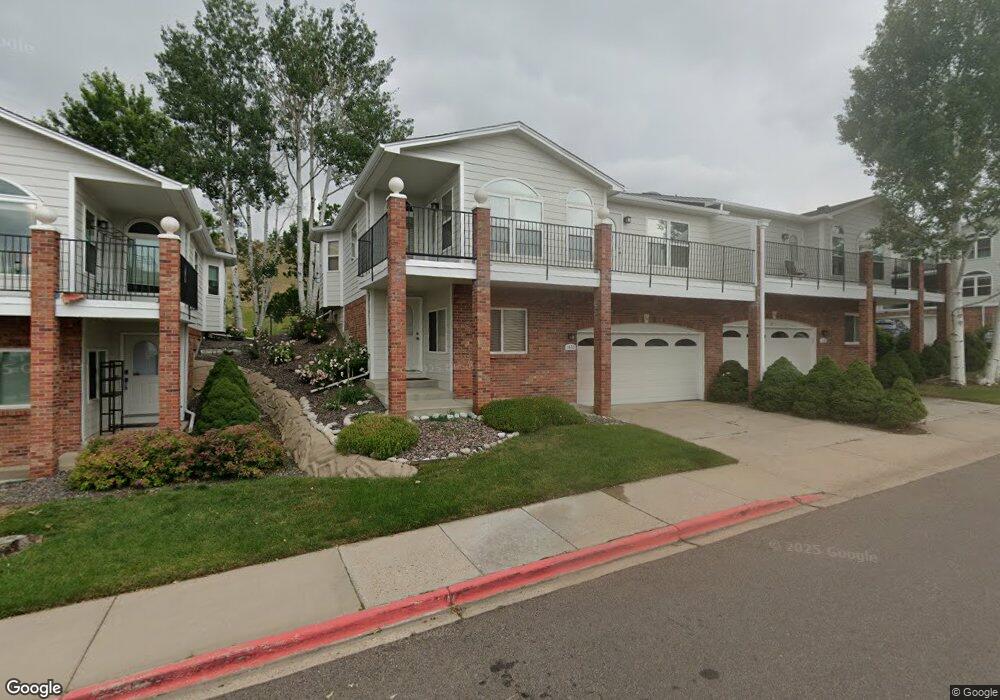
1635 S Deframe St Unit M1635 Lakewood, CO 80228
Green Mountain NeighborhoodEstimated Value: $411,000 - $577,000
3
Beds
3
Baths
1,124
Sq Ft
$431/Sq Ft
Est. Value
About This Home
This home is located at 1635 S Deframe St Unit M1635, Lakewood, CO 80228 and is currently estimated at $483,913, approximately $430 per square foot. 1635 S Deframe St Unit M1635 is a home located in Jefferson County with nearby schools including Hutchinson Elementary School, Dunstan Middle School, and Green Mountain High School.
Ownership History
Date
Name
Owned For
Owner Type
Purchase Details
Closed on
Dec 13, 2013
Sold by
Riggs Jody R
Bought by
Hernandez Jeffrey M
Current Estimated Value
Home Financials for this Owner
Home Financials are based on the most recent Mortgage that was taken out on this home.
Original Mortgage
$251,300
Outstanding Balance
$187,310
Interest Rate
4.14%
Mortgage Type
VA
Estimated Equity
$296,603
Purchase Details
Closed on
Jan 26, 2005
Sold by
Hansen John H
Bought by
Riggs Jody R
Home Financials for this Owner
Home Financials are based on the most recent Mortgage that was taken out on this home.
Original Mortgage
$239,500
Interest Rate
5.85%
Mortgage Type
Purchase Money Mortgage
Purchase Details
Closed on
Oct 16, 2000
Sold by
Foxpointe Vista Phase I Ltd
Bought by
Hansen John H
Home Financials for this Owner
Home Financials are based on the most recent Mortgage that was taken out on this home.
Original Mortgage
$200,000
Interest Rate
7.95%
Create a Home Valuation Report for This Property
The Home Valuation Report is an in-depth analysis detailing your home's value as well as a comparison with similar homes in the area
Home Values in the Area
Average Home Value in this Area
Purchase History
| Date | Buyer | Sale Price | Title Company |
|---|---|---|---|
| Hernandez Jeffrey M | $251,300 | Land Title Guarantee Company | |
| Riggs Jody R | $269,500 | Chicago Title Co | |
| Hansen John H | $239,774 | Land Title |
Source: Public Records
Mortgage History
| Date | Status | Borrower | Loan Amount |
|---|---|---|---|
| Open | Hernandez Jeffrey M | $251,300 | |
| Previous Owner | Riggs Jody R | $239,500 | |
| Previous Owner | Hansen John H | $200,000 | |
| Closed | Riggs Jody R | $30,000 |
Source: Public Records
Tax History Compared to Growth
Tax History
| Year | Tax Paid | Tax Assessment Tax Assessment Total Assessment is a certain percentage of the fair market value that is determined by local assessors to be the total taxable value of land and additions on the property. | Land | Improvement |
|---|---|---|---|---|
| 2024 | $2,839 | $31,477 | $6,030 | $25,447 |
| 2023 | $2,839 | $31,477 | $6,030 | $25,447 |
| 2022 | $2,268 | $24,587 | $4,170 | $20,417 |
| 2021 | $2,301 | $25,295 | $4,290 | $21,005 |
| 2020 | $2,268 | $25,042 | $4,290 | $20,752 |
| 2019 | $2,238 | $25,042 | $4,290 | $20,752 |
| 2018 | $2,144 | $23,201 | $3,600 | $19,601 |
| 2017 | $1,884 | $23,201 | $3,600 | $19,601 |
| 2016 | $1,910 | $21,938 | $2,866 | $19,072 |
| 2015 | $1,928 | $21,938 | $2,866 | $19,072 |
| 2014 | $1,619 | $17,035 | $2,229 | $14,806 |
Source: Public Records
Map
Nearby Homes
- 1648 S Cole St Unit B7
- 1655 S Cole St Unit B1
- 1697 S Cole St Unit C2
- 1650 S Deframe St Unit B5
- 13233 W Utah Cir
- 13934 W Warren Dr
- 13172 W Montana Ave
- 13231 W Montana Ave
- 2175 S Deframe St
- 1882 S Zinnia Way
- 12948 W Oregon Dr
- 1825 S Zang Ct
- 13349 W Alameda Pkwy Unit 303
- 13349 W Alameda Pkwy Unit 104
- 13349 W Alameda Pkwy Unit 102
- 13804 W Iliff Ave
- 12742 W Florida Dr
- 2037 S Welch Cir
- 2336 S Eldridge Ct
- 13126 W Warren Cir
- 1633 S Deframe St Unit M1633
- 1637 S Deframe St Unit 1637
- 1639 S Deframe St Unit N1639
- 1646 S Deframe St B-8 Unit B8
- 1641 S Deframe St Unit O1641
- 1631 S Deframe St Unit C8
- 1631 S Deframe St Unit C7
- 1631 S Deframe St Unit B7
- 1631 S Deframe St Unit B8
- 1631 S Deframe St Unit B6
- 1631 S Deframe St Unit B5
- 1631 S Deframe St Unit B3
- 1631 S Deframe St Unit B4
- 1631 S Deframe St Unit C2
- 1631 S Deframe St Unit C1
- 1631 S Deframe St Unit B1
- 1631 S Deframe St Unit B2
- 1631 S Deframe St Unit A2
- 1631 S Deframe St Unit A1
- 1646 S Deframe St Unit C8