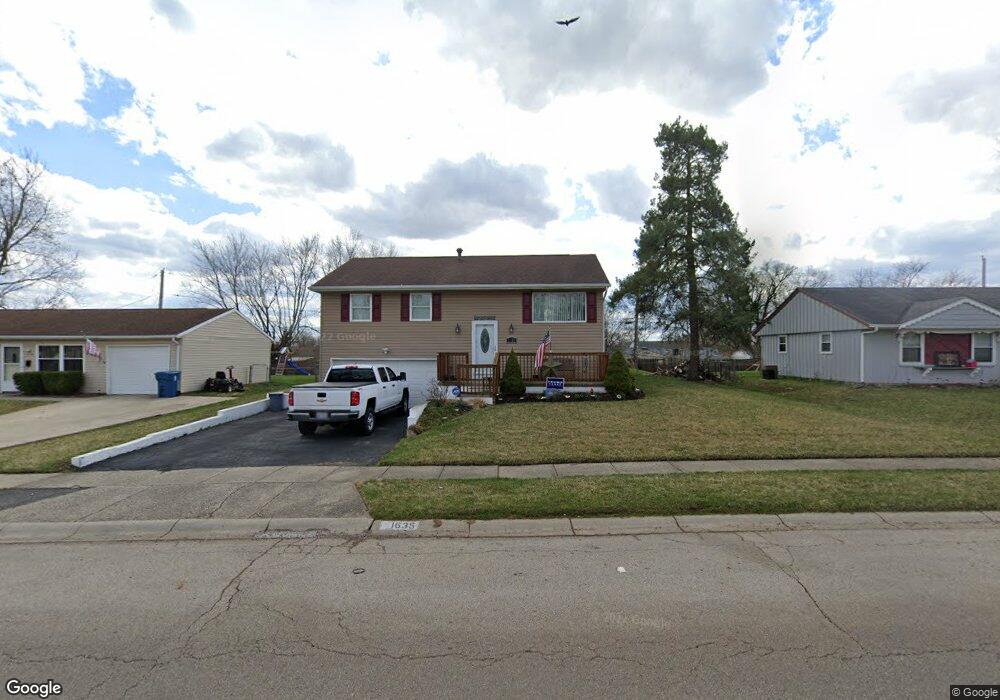
1635 Styer Dr New Carlisle, OH 45344
Estimated Value: $158,000 - $198,563
3
Beds
2
Baths
1,474
Sq Ft
$116/Sq Ft
Est. Value
About This Home
This home is located at 1635 Styer Dr, New Carlisle, OH 45344 and is currently estimated at $171,641, approximately $116 per square foot. 1635 Styer Dr is a home located in Clark County with nearby schools including Park Layne Elementary School, New Carlisle Elementary School, and Donnelsville Elementary School.
Ownership History
Date
Name
Owned For
Owner Type
Purchase Details
Closed on
Sep 16, 2008
Sold by
Ulrich Larry M and Ulrich Sheila F
Bought by
Ulrich Joshua A
Current Estimated Value
Home Financials for this Owner
Home Financials are based on the most recent Mortgage that was taken out on this home.
Original Mortgage
$78,061
Outstanding Balance
$52,046
Interest Rate
6.57%
Mortgage Type
Purchase Money Mortgage
Estimated Equity
$119,595
Purchase Details
Closed on
Jul 28, 2006
Sold by
Sandy Malinda S
Bought by
Ulrich Larry M and Ulrich Sheila F
Purchase Details
Closed on
Jan 9, 2002
Sold by
Mooney Iris L and Mooney Iris L
Bought by
Sandy Malinda S
Purchase Details
Closed on
Aug 16, 1994
Sold by
Morlan Diane E
Bought by
Sandy Malinda S and Mooney Iris
Home Financials for this Owner
Home Financials are based on the most recent Mortgage that was taken out on this home.
Original Mortgage
$47,000
Interest Rate
8.62%
Mortgage Type
New Conventional
Create a Home Valuation Report for This Property
The Home Valuation Report is an in-depth analysis detailing your home's value as well as a comparison with similar homes in the area
Home Values in the Area
Average Home Value in this Area
Purchase History
| Date | Buyer | Sale Price | Title Company |
|---|---|---|---|
| Ulrich Joshua A | $79,000 | Attorney | |
| Ulrich Larry M | $61,500 | None Available | |
| Sandy Malinda S | -- | -- | |
| Sandy Malinda S | $65,000 | -- |
Source: Public Records
Mortgage History
| Date | Status | Borrower | Loan Amount |
|---|---|---|---|
| Open | Ulrich Joshua A | $78,061 | |
| Previous Owner | Sandy Malinda S | $47,000 |
Source: Public Records
Tax History Compared to Growth
Tax History
| Year | Tax Paid | Tax Assessment Tax Assessment Total Assessment is a certain percentage of the fair market value that is determined by local assessors to be the total taxable value of land and additions on the property. | Land | Improvement |
|---|---|---|---|---|
| 2024 | $1,923 | $40,430 | $7,170 | $33,260 |
| 2023 | $1,923 | $40,430 | $7,170 | $33,260 |
| 2022 | $1,936 | $40,430 | $7,170 | $33,260 |
| 2021 | $1,847 | $34,860 | $5,470 | $29,390 |
| 2020 | $1,852 | $34,860 | $5,470 | $29,390 |
| 2019 | $1,845 | $34,860 | $5,470 | $29,390 |
| 2018 | $1,476 | $25,730 | $5,320 | $20,410 |
| 2017 | $1,467 | $29,131 | $5,320 | $23,811 |
| 2016 | $1,406 | $29,131 | $5,320 | $23,811 |
| 2015 | $1,473 | $28,785 | $4,974 | $23,811 |
| 2014 | $1,465 | $28,785 | $4,974 | $23,811 |
| 2013 | $1,467 | $28,785 | $4,974 | $23,811 |
Source: Public Records
Map
Nearby Homes
- 1616 Styer Dr
- 1689 Dale Ridge Rd
- 842 Edgewick Rd
- 510 Bowser Dr
- 1215 Chalet Dr
- 1210 Campbell Ave
- 1143 Bookwalter Ave
- 1124 Burket Dr
- 1115 Frayne Dr
- 1190 Shirra Ave
- 956 Styer Dr
- 216 Braun St
- 429 Tulip Rd
- 522 Caldwell Cir
- 423 Sycamore Rd
- 326 Kennedy Dr
- 870 Corvette Ave
- 851 Corvette Ave
- 518 Beach Dr
- 15 Tulip Rd