S
Seller's Agent in 2020
Sherry Balhorn
Remerica Hometown One
(734) 420-3400
37 Total Sales
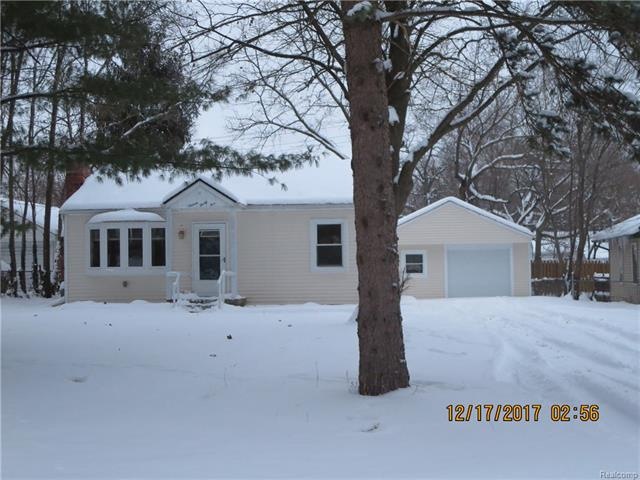
Price reduction!! Excellent rental. 2 bedroom, great kitchen with dining /eating space, garage and close to college campus. Move in ready!!! Perfect starter, rental or retirement home in a great neighborhood. Delightful 2 bedroom 1 bath vinyl ranch complete with appliances including washer and dryer, newer hot water heater. newly refinished hardwood flooring, freshly painted, updated kitchen with maple cabinets, Magic windows with warranty in living room and gas fireplace. Oversized 1 1/2 Car detached Garage, large fenced lot, quiet dead end street and walking distance to stores, restaurants and OCC campus. Lake privileges on Union Lake undocumented. No home owner association. West Bloomfield township, paved street, well & city sewer. All info & measurements deemed accurate however please verify accuracy with your clients.
Last Agent to Sell the Property
Virginia Havermahl
A Byer Realty LLC License #6502360526 Listed on: 09/20/2017
| Date | Type | Sale Price | Title Company |
|---|---|---|---|
| Warranty Deed | $145,000 | Select Title Company | |
| Warranty Deed | $120,000 | None Available | |
| Warranty Deed | $128,000 | Metropolitan Title Company | |
| Deed | $102,000 | -- | |
| Deed | $80,000 | -- |
| Date | Status | Loan Amount | Loan Type |
|---|---|---|---|
| Open | $125,000 | New Conventional | |
| Previous Owner | $122,580 | VA | |
| Previous Owner | $101,120 | No Value Available | |
| Previous Owner | $81,600 | No Value Available |
| Date | Event | Price | Change | Sq Ft Price |
|---|---|---|---|---|
| 09/24/2020 09/24/20 | Sold | $145,000 | +4.3% | $201 / Sq Ft |
| 09/01/2020 09/01/20 | Pending | -- | -- | -- |
| 07/31/2020 07/31/20 | For Sale | $139,000 | +15.8% | $193 / Sq Ft |
| 04/06/2018 04/06/18 | Sold | $120,000 | -7.7% | $150 / Sq Ft |
| 02/18/2018 02/18/18 | Pending | -- | -- | -- |
| 02/05/2018 02/05/18 | Price Changed | $129,999 | -3.6% | $162 / Sq Ft |
| 11/17/2017 11/17/17 | Price Changed | $134,900 | -3.6% | $169 / Sq Ft |
| 11/05/2017 11/05/17 | For Sale | $139,900 | +16.6% | $175 / Sq Ft |
| 10/20/2017 10/20/17 | Off Market | $120,000 | -- | -- |
| 09/20/2017 09/20/17 | For Sale | $139,900 | -- | $175 / Sq Ft |
| Year | Tax Paid | Tax Assessment Tax Assessment Total Assessment is a certain percentage of the fair market value that is determined by local assessors to be the total taxable value of land and additions on the property. | Land | Improvement |
|---|---|---|---|---|
| 2024 | $1,602 | $64,210 | $0 | $0 |
| 2022 | $1,520 | $59,180 | $21,110 | $38,070 |
| 2021 | $1,891 | $53,720 | $0 | $0 |
| 2020 | $1,263 | $52,140 | $21,110 | $31,030 |
| 2018 | $1,991 | $46,340 | $15,340 | $31,000 |
| 2015 | -- | $35,570 | $0 | $0 |
| 2014 | -- | $33,400 | $0 | $0 |
| 2011 | -- | $31,900 | $0 | $0 |
S
Seller's Agent in 2020
Sherry Balhorn
Remerica Hometown One
(734) 420-3400
37 Total Sales

Buyer's Agent in 2020
Christine Taube
RE/MAX Michigan
(248) 202-0130
35 Total Sales
V
Seller's Agent in 2018
Virginia Havermahl
A Byer Realty LLC
Source: Realcomp
MLS Number: 217085392
APN: 18-06-205-009
Disclaimer: Certain information contained herein is derived from information provided by parties other than Homes.com. All information provided is deemed reliable, but is not guaranteed to be accurate and should be independently verified.
![]() IDX provided courtesy of Realcomp II Ltd. via Ten-X and MLS
IDX provided courtesy of Realcomp II Ltd. via Ten-X and MLS
Copyright 2025 Realcomp II Ltd. Shareholders
IDX information is provided exclusively for consumers' personal, noncommercial use and may not be used for any purpose other than to identify prospective properties consumers may be interested in purchasing. The accuracy of all information, regardless of source, is not guaranteed or warranted. All information should be independently verified.
Listing Information presented by local MLS brokerage: Ten-X, local REALTOR®- Arlene Richardson - (888)-952-6393