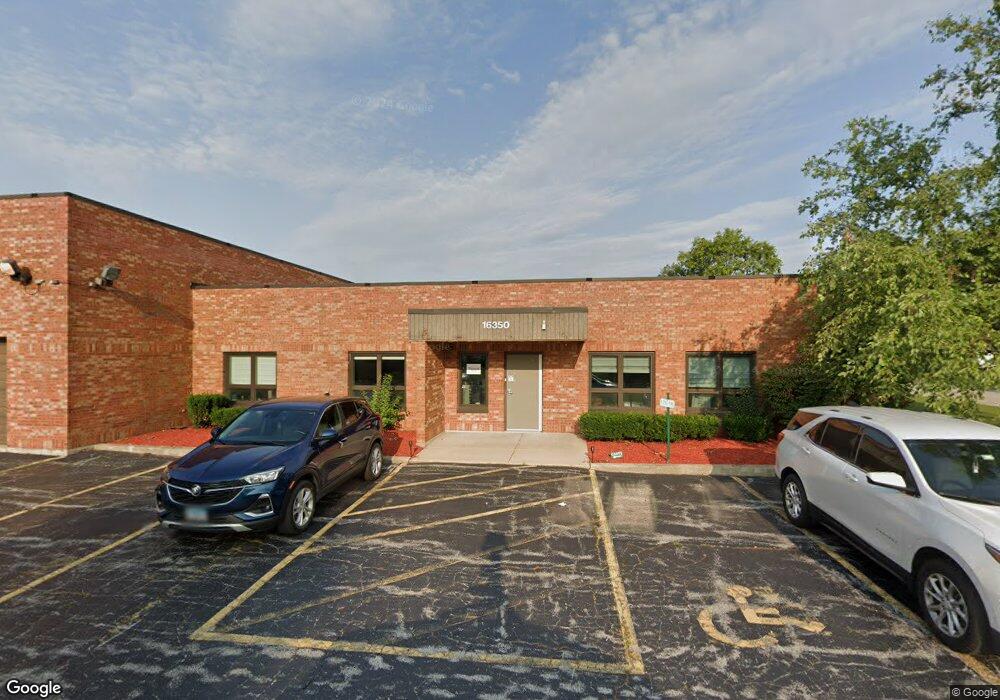
16350 105th Ct Orland Park, IL 60467
Centennial NeighborhoodEstimated Value: $520,631
--
Bed
--
Bath
--
Sq Ft
0.69
Acres
About This Home
This home is located at 16350 105th Ct, Orland Park, IL 60467 and is currently estimated at $520,631. 16350 105th Ct is a home located in Cook County with nearby schools including Meadow Ridge School, Orland Center School, and Century Junior High School.
Ownership History
Date
Name
Owned For
Owner Type
Purchase Details
Closed on
Apr 28, 2017
Sold by
Wfo Reo 2014 02 Llc
Bought by
Dewey Cheatum & Home Properties Llc
Current Estimated Value
Purchase Details
Closed on
Feb 3, 2016
Sold by
Arm Capital Ventures Llc
Bought by
Wfo Reo 2014 & 02 Llc
Purchase Details
Closed on
Mar 10, 2008
Sold by
Op Land Llc
Bought by
Bti Telecommunications Inc and Arm Capital Ventures Llc
Home Financials for this Owner
Home Financials are based on the most recent Mortgage that was taken out on this home.
Original Mortgage
$496,000
Interest Rate
7.25%
Mortgage Type
Commercial
Purchase Details
Closed on
May 5, 2005
Sold by
Founders Bank
Bought by
Op Land Llc
Home Financials for this Owner
Home Financials are based on the most recent Mortgage that was taken out on this home.
Original Mortgage
$371,000
Interest Rate
6.37%
Mortgage Type
Commercial
Create a Home Valuation Report for This Property
The Home Valuation Report is an in-depth analysis detailing your home's value as well as a comparison with similar homes in the area
Home Values in the Area
Average Home Value in this Area
Purchase History
| Date | Buyer | Sale Price | Title Company |
|---|---|---|---|
| Dewey Cheatum & Home Properties Llc | $330,000 | Chicago Title | |
| Wfo Reo 2014 & 02 Llc | -- | Attorney | |
| Bti Telecommunications Inc | $620,000 | Cti | |
| Op Land Llc | $449,500 | Stewart Title Of Illinois |
Source: Public Records
Mortgage History
| Date | Status | Borrower | Loan Amount |
|---|---|---|---|
| Previous Owner | Bti Telecommunications Inc | $496,000 | |
| Previous Owner | Op Land Llc | $371,000 |
Source: Public Records
Tax History Compared to Growth
Tax History
| Year | Tax Paid | Tax Assessment Tax Assessment Total Assessment is a certain percentage of the fair market value that is determined by local assessors to be the total taxable value of land and additions on the property. | Land | Improvement |
|---|---|---|---|---|
| 2024 | $25,652 | $102,501 | $93,516 | $8,985 |
| 2023 | $24,943 | $168,113 | $93,516 | $74,597 |
| 2022 | $24,943 | $83,268 | $44,888 | $38,380 |
| 2021 | $24,089 | $83,265 | $44,887 | $38,378 |
| 2020 | $23,187 | $83,265 | $44,887 | $38,378 |
| 2019 | $22,645 | $82,500 | $22,443 | $60,057 |
| 2018 | $22,024 | $82,500 | $22,443 | $60,057 |
| 2017 | $16,082 | $61,633 | $22,443 | $39,190 |
| 2016 | $14,090 | $50,498 | $13,092 | $37,406 |
| 2015 | $13,955 | $50,498 | $13,092 | $37,406 |
| 2014 | $13,748 | $50,498 | $13,092 | $37,406 |
| 2013 | $13,415 | $52,341 | $18,703 | $33,638 |
Source: Public Records
Map
Nearby Homes
- 16230 107th Ave
- 10700 165th St
- 16540 Pear Ave
- 16546 Pear Ave
- 16629 Grants Trail
- 16620 Grants Trail
- 16221 Kingsport Rd
- 16430 Stuart Ave
- 10595 W 167th St
- 16400 Lee Ave
- 10300 W 159th St
- 16430 Francis Ct
- 10701 Gabrielle Ln
- 11156 Karen Dr
- 11138 Alpine Ln
- 10711 Gigi Dr
- 9910 W 167th St
- 16738 Lee St
- 10653 Great Egret Dr
- 16705 Wolf Rd
- 16350 105th Ct Unit B
- 10430 105 Ct
- 10457 163rd Place
- 10457 163rd Place
- 10609 163rd Place
- 10470 163rd Place
- 16400 105th Ct
- 10450 163rd Place
- 16400 105th Ct
- 10468 163rd Place
- 10629 163rd Place
- 10482 163rd Place
- 10608 163rd Place
- 10466 163rd Place
- 10466 163rd Place
- 10451 163rd Place
- 10445 163rd Place
- 10446 163rd Place Unit 3
- 10448 163rd Place
- 10444 163rd Place