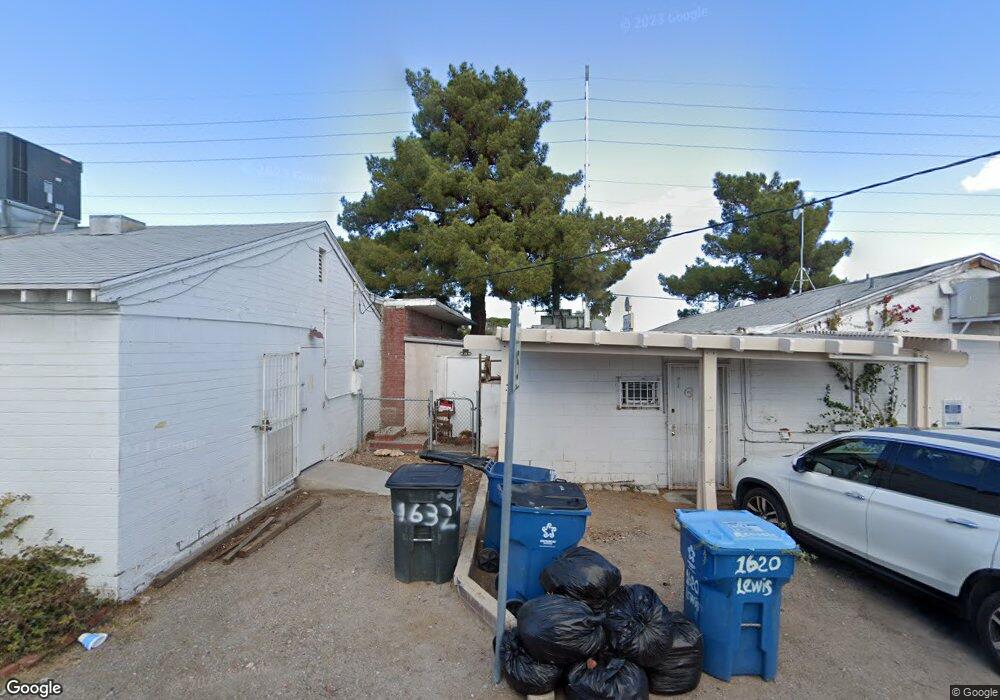
1636 E Charleston Blvd Las Vegas, NV 89104
Huntridge NeighborhoodEstimated Value: $516,427
2
Beds
4
Baths
1,989
Sq Ft
$260/Sq Ft
Est. Value
About This Home
This home is located at 1636 E Charleston Blvd, Las Vegas, NV 89104 and is currently estimated at $516,427, approximately $259 per square foot. 1636 E Charleston Blvd is a home located in Clark County with nearby schools including Crestwood Elementary School, Roy West Martin Middle School, and Valley High School.
Ownership History
Date
Name
Owned For
Owner Type
Purchase Details
Closed on
Aug 7, 2017
Sold by
Bumergijit Bang On
Bought by
The Bang Bumerjitt Living Trust
Current Estimated Value
Home Financials for this Owner
Home Financials are based on the most recent Mortgage that was taken out on this home.
Original Mortgage
$127,187
Interest Rate
3.94%
Mortgage Type
FHA
Purchase Details
Closed on
Jun 4, 2009
Sold by
Bumrungjitt Somkuan
Bought by
Bumrungjitt Bang On
Purchase Details
Closed on
Sep 5, 2007
Sold by
Helm Richard H and Helm Edeltraud J
Bought by
Bumrungjitt Somkuan and Bumrungjitt Bang On
Home Financials for this Owner
Home Financials are based on the most recent Mortgage that was taken out on this home.
Original Mortgage
$310,000
Interest Rate
6.67%
Mortgage Type
Seller Take Back
Purchase Details
Closed on
Dec 26, 1995
Sold by
Marayonk Pakron and Marayonk Runchuan
Bought by
Helm Richard H and Helm Edeltraud J
Create a Home Valuation Report for This Property
The Home Valuation Report is an in-depth analysis detailing your home's value as well as a comparison with similar homes in the area
Home Values in the Area
Average Home Value in this Area
Purchase History
| Date | Buyer | Sale Price | Title Company |
|---|---|---|---|
| The Bang Bumerjitt Living Trust | -- | None Available | |
| Bumrungjitt Bang On | -- | None Available | |
| Bumrungjitt Somkuan | $325,000 | Chicago Title | |
| Helm Richard H | $97,000 | Land Title |
Source: Public Records
Mortgage History
| Date | Status | Borrower | Loan Amount |
|---|---|---|---|
| Previous Owner | The Bang Bumerjitt Living Trust | $127,187 | |
| Previous Owner | Bumrungjitt Somkuan | $310,000 |
Source: Public Records
Tax History Compared to Growth
Tax History
| Year | Tax Paid | Tax Assessment Tax Assessment Total Assessment is a certain percentage of the fair market value that is determined by local assessors to be the total taxable value of land and additions on the property. | Land | Improvement |
|---|---|---|---|---|
| 2025 | $1,386 | $45,985 | $19,439 | $26,546 |
| 2024 | $1,284 | $45,985 | $19,439 | $26,546 |
| 2023 | $1,284 | $39,379 | $16,008 | $23,371 |
| 2022 | $1,189 | $36,191 | $14,865 | $21,326 |
| 2021 | $1,144 | $34,809 | $14,865 | $19,944 |
| 2020 | $1,117 | $34,075 | $14,865 | $19,210 |
| 2019 | $1,063 | $33,499 | $14,865 | $18,634 |
| 2018 | $1,014 | $32,938 | $14,865 | $18,073 |
| 2017 | $1,042 | $31,774 | $13,721 | $18,053 |
| 2016 | $950 | $28,879 | $11,435 | $17,444 |
| 2015 | $947 | $28,504 | $11,435 | $17,069 |
| 2014 | $935 | $28,082 | $11,435 | $16,647 |
Source: Public Records
Map
Nearby Homes
- 228 S 16th St
- 1305 S 16th St
- 1421 Norman Ave
- 1401 Jessica Ave
- 1411 Norman Ave
- 1408 E Carson Ave
- 1700 Sweeney Ave
- 500 S 13th St Unit C5
- 500 S 13th St Unit C4
- 1314 Jessica Ave
- 1413 S 17th St
- 1913 Houston Dr
- 223 Tower St
- 1600 Becke Cir
- 1925 Franklin Ave
- 200 N Bruce St Unit A
- 215 N Bruce St
- 1505 E Ogden Ave
- 1720 E Oakey Blvd
- 121 N 20th St
- 1631 Thelma Ln
- 1637 Thelma Ln
- 1106 S 17th St
- 1106 S 17th St Unit n/a
- 1106 S 17th St Unit 1108
- 1627 Thelma Ln
- 1623 Thelma Ln Unit Apartment
- 1623 Thelma Ln
- 1619 Thelma Ln
- 1619 Thelma Ln Unit 1
- 1620 Thelma Ln Unit 1620
- 1628 Thelma Ln
- 1628 Thelma Ln Unit 1628
- 1630 Thelma Ln Unit 1
- 1647 E Charleston Blvd
- 1626 Thelma Ln
- 1122 S 17th St
- 1622 Thelma Ln Unit 1622
- 1622 Thelma Ln Unit B
- 1622 Thelma Ln Unit A