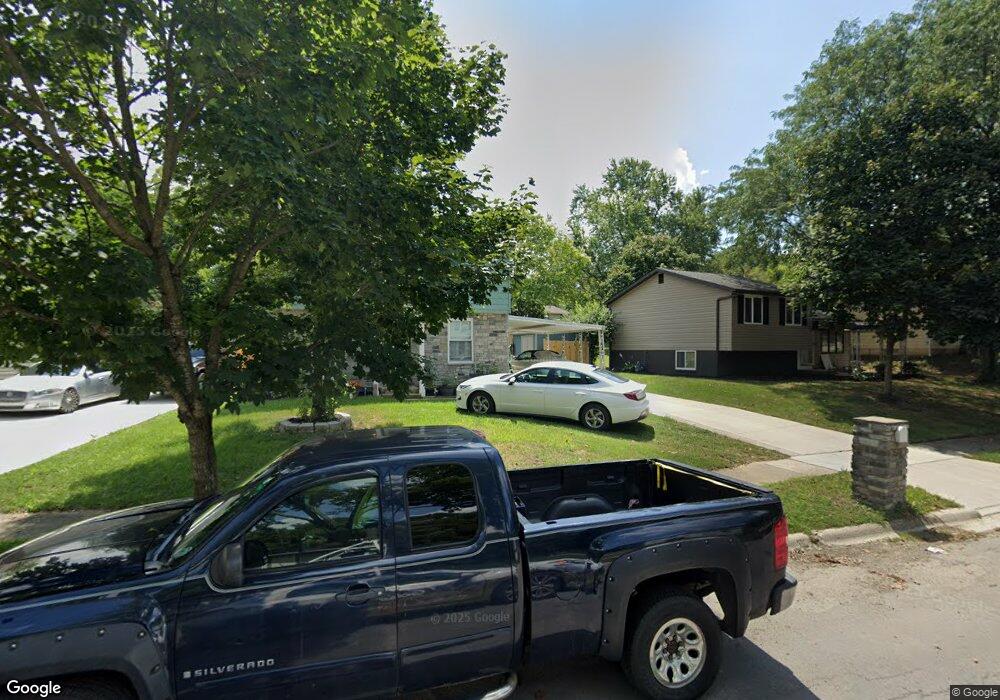
1636 Hollow Run Dr Columbus, OH 43223
Riverbend NeighborhoodEstimated Value: $196,000 - $244,000
4
Beds
2
Baths
1,196
Sq Ft
$185/Sq Ft
Est. Value
About This Home
This home is located at 1636 Hollow Run Dr, Columbus, OH 43223 and is currently estimated at $221,091, approximately $184 per square foot. 1636 Hollow Run Dr is a home located in Franklin County with nearby schools including James A Harmon Elementary School, Franklin Woods Intermediate School, and Finland Middle School.
Ownership History
Date
Name
Owned For
Owner Type
Purchase Details
Closed on
Apr 15, 2021
Sold by
Bee Venus M and Bee Joseph A
Bought by
Natividad Laura Martinez and Cruz Onesima Natividad
Current Estimated Value
Home Financials for this Owner
Home Financials are based on the most recent Mortgage that was taken out on this home.
Original Mortgage
$96,000
Outstanding Balance
$86,815
Interest Rate
3.1%
Mortgage Type
New Conventional
Estimated Equity
$134,276
Purchase Details
Closed on
Apr 1, 2021
Sold by
Venus M Bee Living Trust and Joseph A Bee Living Trust
Bought by
Natividad Laura Martinez and Cruz Onesima Natividad
Home Financials for this Owner
Home Financials are based on the most recent Mortgage that was taken out on this home.
Original Mortgage
$96,000
Outstanding Balance
$86,815
Interest Rate
3.1%
Mortgage Type
New Conventional
Estimated Equity
$134,276
Purchase Details
Closed on
Jun 9, 2009
Sold by
Kenny Debra D and Kenny Michael J
Bought by
Bee Venus M and Bee Joseph A
Purchase Details
Closed on
Mar 25, 2003
Sold by
Bee Venus M and Bee Joseph A
Bought by
Kenny Debra D
Home Financials for this Owner
Home Financials are based on the most recent Mortgage that was taken out on this home.
Original Mortgage
$85,000
Interest Rate
5.76%
Mortgage Type
Seller Take Back
Purchase Details
Closed on
Jun 25, 1997
Sold by
Bee Joseph A and Bee Venus M
Bought by
Bee Venus M and Bee Joseph A
Purchase Details
Closed on
Jun 1, 1985
Create a Home Valuation Report for This Property
The Home Valuation Report is an in-depth analysis detailing your home's value as well as a comparison with similar homes in the area
Home Values in the Area
Average Home Value in this Area
Purchase History
| Date | Buyer | Sale Price | Title Company |
|---|---|---|---|
| Natividad Laura Martinez | $146,000 | Northwest Select Ttl Agcy Ll | |
| Natividad Laura Martinez | $146,000 | Northwest Select Agency | |
| Bee Venus M | -- | Attorney | |
| Kenny Debra D | $170,000 | -- | |
| Bee Venus M | -- | -- | |
| Bee Joseph A | -- | -- | |
| -- | $41,500 | -- |
Source: Public Records
Mortgage History
| Date | Status | Borrower | Loan Amount |
|---|---|---|---|
| Open | Natividad Laura Martinez | $96,000 | |
| Previous Owner | Natividad Laura Martinez | $96,000 | |
| Previous Owner | Kenny Debra D | $85,000 |
Source: Public Records
Tax History Compared to Growth
Tax History
| Year | Tax Paid | Tax Assessment Tax Assessment Total Assessment is a certain percentage of the fair market value that is determined by local assessors to be the total taxable value of land and additions on the property. | Land | Improvement |
|---|---|---|---|---|
| 2024 | $2,492 | $68,360 | $16,520 | $51,840 |
| 2023 | $2,448 | $68,355 | $16,520 | $51,835 |
| 2022 | $1,770 | $36,270 | $9,000 | $27,270 |
| 2021 | $1,869 | $36,270 | $9,000 | $27,270 |
| 2020 | $1,843 | $36,270 | $9,000 | $27,270 |
| 2019 | $1,680 | $29,160 | $7,490 | $21,670 |
| 2018 | $836 | $29,160 | $7,490 | $21,670 |
| 2017 | $1,667 | $29,160 | $7,490 | $21,670 |
| 2016 | $1,586 | $25,480 | $4,970 | $20,510 |
| 2015 | $793 | $25,480 | $4,970 | $20,510 |
| 2014 | $1,587 | $25,480 | $4,970 | $20,510 |
| 2013 | $875 | $28,315 | $5,530 | $22,785 |
Source: Public Records
Map
Nearby Homes
- 3488 Rocky Rd
- 1657 Ripplebrook Rd
- 3206 Andy Terrace
- 3623 High Creek Dr
- 1485 Demorest Rd
- 3326 Bluhm Ct
- 1465 Tall Meadows Dr
- 1830 Winding Hollow Dr
- 3728 Greenock Ct
- 2930 Alkire Rd
- 2062 Summer Banks Dr
- 1226 Pinnacle Dr
- 1181 Onslow Dr
- 2800 Alkire Rd
- 3766 Dunlane Ct
- 1520 Fall Brook Rd
- 2987 Daisy Ln
- 3814 Clime Rd
- 2188 Dry Ridge Ct
- 3360 Briggs Rd
- 3519 Rivercrest Dr
- 1646 Hollow Run Dr
- 3513 Rivercrest Dr
- 1651 Rivermont Rd
- 1657 Rivermont Rd
- 1621 Hollow Run Dr
- 1645 Rivermont Rd
- 1652 Hollow Run Dr
- 1663 Rivermont Rd
- 1627 Regents Hill Dr
- 1639 Regents Hill Dr
- 1629 Hollow Run Dr
- 3528 Rivercrest Dr
- 1658 Hollow Run Dr
- 1625 Hollow Run Dr
- 3522 Rivercrest Dr
- 1669 Rivermont Rd
- 3516 Rivercrest Dr
- 1635 Hollow Run Dr
- 3510 Rivercrest Dr