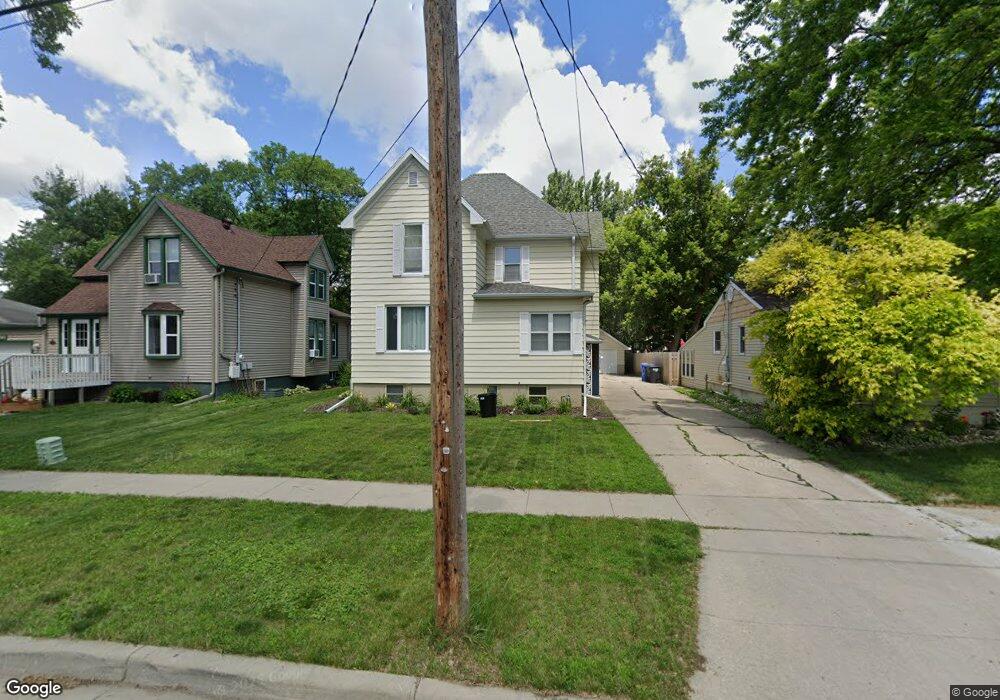
1637 8th Ave S Fargo, ND 58103
Jefferson-Carl NeighborhoodEstimated Value: $233,000 - $294,287
Studio
--
Bath
3,506
Sq Ft
$76/Sq Ft
Est. Value
About This Home
This home is located at 1637 8th Ave S, Fargo, ND 58103 and is currently estimated at $267,322, approximately $76 per square foot. 1637 8th Ave S is a home located in Cass County with nearby schools including Jefferson Elementary School, Carl Ben Eielson Middle School, and South High School.
Ownership History
Date
Name
Owned For
Owner Type
Purchase Details
Closed on
Aug 12, 2021
Sold by
Blue Thistle Properties Llc
Bought by
Ecjstein John and Ecjstein Jenna
Current Estimated Value
Home Financials for this Owner
Home Financials are based on the most recent Mortgage that was taken out on this home.
Original Mortgage
$229,270
Outstanding Balance
$208,477
Interest Rate
2.9%
Mortgage Type
FHA
Estimated Equity
$58,845
Purchase Details
Closed on
Dec 22, 2020
Sold by
Hagen John and Hagen Ellen
Bought by
Blue Thistle Properties Llc
Purchase Details
Closed on
Jan 5, 2016
Sold by
Barchinger Roland L and Kragt Barchinger Jeanne D
Bought by
Grace Evengelical Lutheran Church Unalte
Home Financials for this Owner
Home Financials are based on the most recent Mortgage that was taken out on this home.
Original Mortgage
$176,739
Interest Rate
3.5%
Mortgage Type
FHA
Create a Home Valuation Report for This Property
The Home Valuation Report is an in-depth analysis detailing your home's value as well as a comparison with similar homes in the area
Home Values in the Area
Average Home Value in this Area
Purchase History
| Date | Buyer | Sale Price | Title Company |
|---|---|---|---|
| Ecjstein John | $233,500 | Fm Title | |
| Blue Thistle Properties Llc | -- | The Title Co Residential | |
| Grace Evengelical Lutheran Church Unalte | $180,000 | Title Co |
Source: Public Records
Mortgage History
| Date | Status | Borrower | Loan Amount |
|---|---|---|---|
| Open | Ecjstein John | $229,270 | |
| Previous Owner | Grace Evengelical Lutheran Church Unalte | $176,739 |
Source: Public Records
Tax History
| Year | Tax Paid | Tax Assessment Tax Assessment Total Assessment is a certain percentage of the fair market value that is determined by local assessors to be the total taxable value of land and additions on the property. | Land | Improvement |
|---|---|---|---|---|
| 2024 | $3,500 | $133,150 | $20,050 | $113,100 |
| 2023 | $3,981 | $133,150 | $20,050 | $113,100 |
| 2022 | $3,697 | $121,050 | $20,050 | $101,000 |
| 2021 | $2,543 | $79,950 | $20,050 | $59,900 |
| 2020 | $2,563 | $79,950 | $20,050 | $59,900 |
| 2019 | $2,345 | $73,350 | $11,900 | $61,450 |
| 2018 | $2,318 | $73,350 | $11,900 | $61,450 |
| 2017 | $2,297 | $73,350 | $11,900 | $61,450 |
| 2016 | $2,064 | $71,200 | $11,900 | $59,300 |
| 2015 | $2,044 | $65,950 | $8,150 | $57,800 |
| 2014 | $1,865 | $57,350 | $8,150 | $49,200 |
| 2013 | $1,852 | $57,350 | $8,150 | $49,200 |
Source: Public Records
Map
Nearby Homes
- 1622 7th Ave S
- 1638 8th Ave S
- 1625 9th Ave S
- 1524 5th Ave S
- 1613 5th Ave S
- 1422 8th Ave S
- 702 21st St S
- 1529 4th Ave S
- 1011 14th St S
- 2126 5th Ave S
- 1629 2nd Ave S
- 1345 4th Ave S
- 2209 6th Ave S
- 1524 1st Ave S
- 1101 22nd St S Unit 6
- 2213 5th Ave S
- 1450 1st Ave S
- 1129 22nd St S Unit B09
- 1129 22nd St S Unit B12
- 1334 17th St S
Your Personal Tour Guide
Ask me questions while you tour the home.