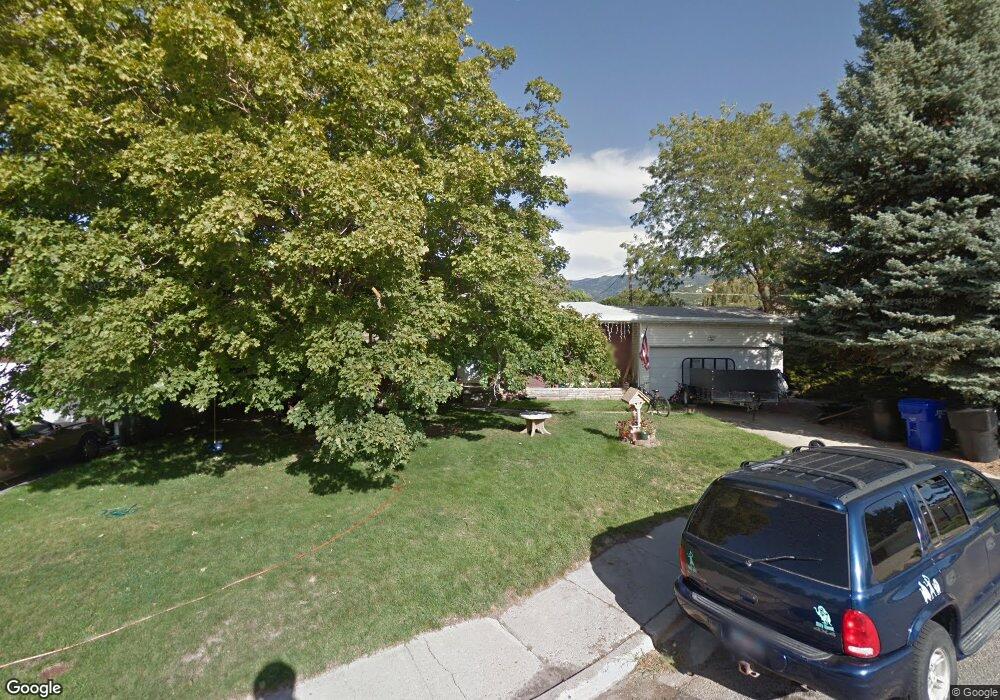
1637 Artistic Cir Bountiful, UT 84010
Estimated Value: $511,000 - $558,000
4
Beds
2
Baths
1,112
Sq Ft
$482/Sq Ft
Est. Value
About This Home
This home is located at 1637 Artistic Cir, Bountiful, UT 84010 and is currently estimated at $535,618, approximately $481 per square foot. 1637 Artistic Cir is a home located in Davis County with nearby schools including Bountiful Elementary School, Mueller Park Junior High School, and Bountiful High School.
Ownership History
Date
Name
Owned For
Owner Type
Purchase Details
Closed on
Sep 15, 2017
Sold by
Fink Jennifer Mae
Bought by
Mower Jennifer M and Mower Keith
Current Estimated Value
Purchase Details
Closed on
Jul 3, 2007
Sold by
Fisher Jim and Fink Jennifer Mae
Bought by
Fink Jennifer Mae
Home Financials for this Owner
Home Financials are based on the most recent Mortgage that was taken out on this home.
Original Mortgage
$158,400
Interest Rate
6.36%
Mortgage Type
New Conventional
Purchase Details
Closed on
Jul 22, 2003
Sold by
Fisher Jim
Bought by
Fisher Jim and Fink Jennifer Mae
Home Financials for this Owner
Home Financials are based on the most recent Mortgage that was taken out on this home.
Original Mortgage
$153,000
Interest Rate
5.15%
Mortgage Type
VA
Create a Home Valuation Report for This Property
The Home Valuation Report is an in-depth analysis detailing your home's value as well as a comparison with similar homes in the area
Purchase History
| Date | Buyer | Sale Price | Title Company |
|---|---|---|---|
| Mower Jennifer M | -- | -- | |
| Fink Jennifer Mae | -- | Backman Title Services | |
| Fisher Jim | -- | Security Title Company | |
| Fisher Jim | -- | Security Title Company |
Source: Public Records
Mortgage History
| Date | Status | Borrower | Loan Amount |
|---|---|---|---|
| Previous Owner | Fink Jennifer Mae | $158,400 | |
| Previous Owner | Fisher Jim | $153,000 |
Source: Public Records
Tax History
| Year | Tax Paid | Tax Assessment Tax Assessment Total Assessment is a certain percentage of the fair market value that is determined by local assessors to be the total taxable value of land and additions on the property. | Land | Improvement |
|---|---|---|---|---|
| 2025 | $2,866 | $261,250 | $124,909 | $136,341 |
| 2024 | $2,674 | $252,999 | $109,495 | $143,504 |
| 2023 | $2,559 | $241,450 | $111,895 | $129,554 |
| 2022 | $2,678 | $459,000 | $202,972 | $256,028 |
| 2021 | $2,207 | $316,000 | $147,709 | $168,291 |
| 2020 | $1,912 | $274,000 | $126,679 | $147,321 |
| 2019 | $1,922 | $269,000 | $137,246 | $131,754 |
| 2018 | $1,795 | $247,000 | $134,614 | $112,386 |
| 2016 | $1,612 | $120,505 | $54,817 | $65,688 |
| 2015 | $1,562 | $110,110 | $54,817 | $55,293 |
| 2014 | $1,620 | $117,956 | $54,817 | $63,139 |
| 2013 | -- | $97,949 | $42,890 | $55,059 |
Source: Public Records
Map
Nearby Homes
- 1820 S 50 W
- 53 W 1800 S
- 141 E 1650 S
- 2 E Wicker Ln
- 288 E 1650 S
- 33 W Wicker Ln
- 2064 S Orchard Dr
- 1350 S 200 W
- 1314 S 200 W Unit 19
- 188 E 2050 S Unit D3
- 1950 S 200 W Unit 32
- 380 E 1500 S
- 291 E 1950 S
- 109 W 900 S
- 438 E 1800 S
- 2038 S 350 E Unit 3
- 2059 S 350 E Unit 6
- 2046 S 350 E Unit 4
- 320 E 2100 S
- 1886 S Jeri Dr
Your Personal Tour Guide
Ask me questions while you tour the home.