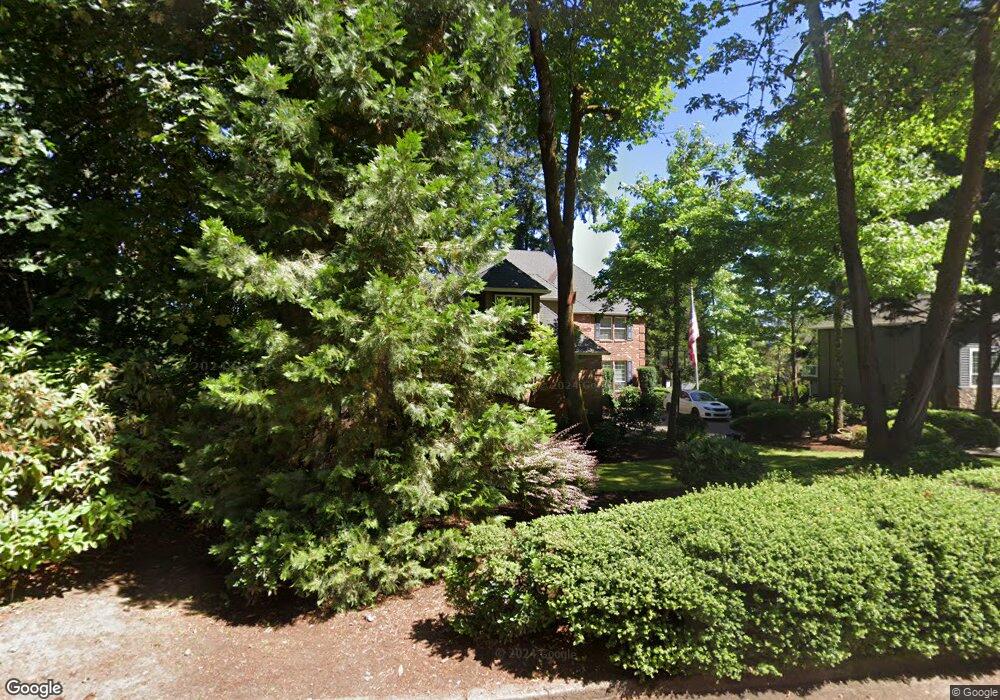
1637 Maple St Lakeoswego, OR 97035
McVey-South Shore NeighborhoodEstimated Value: $1,752,000 - $2,686,000
4
Beds
4
Baths
4,744
Sq Ft
$455/Sq Ft
Est. Value
About This Home
This home is located at 1637 Maple St, Lakeoswego, OR 97035 and is currently estimated at $2,157,754, approximately $454 per square foot. 1637 Maple St is a home located in Clackamas County with nearby schools including Hallinan Elementary School, Lakeridge Middle School, and Lakeridge High School.
Ownership History
Date
Name
Owned For
Owner Type
Purchase Details
Closed on
Oct 26, 2006
Sold by
Bogert Dallas D and Bogert Rayeanne
Bought by
Mccluskey Sean M
Current Estimated Value
Home Financials for this Owner
Home Financials are based on the most recent Mortgage that was taken out on this home.
Original Mortgage
$206,250
Interest Rate
6.3%
Mortgage Type
Stand Alone Second
Purchase Details
Closed on
Nov 27, 2001
Sold by
Ar Williamson Construction
Bought by
Bogert Dallas D and Bogert Rayeann
Home Financials for this Owner
Home Financials are based on the most recent Mortgage that was taken out on this home.
Original Mortgage
$650,000
Interest Rate
6.63%
Create a Home Valuation Report for This Property
The Home Valuation Report is an in-depth analysis detailing your home's value as well as a comparison with similar homes in the area
Home Values in the Area
Average Home Value in this Area
Purchase History
| Date | Buyer | Sale Price | Title Company |
|---|---|---|---|
| Mccluskey Sean M | $1,375,000 | Ticor Title Insurance Compan | |
| Bogert Dallas D | $724,500 | Stewart Title |
Source: Public Records
Mortgage History
| Date | Status | Borrower | Loan Amount |
|---|---|---|---|
| Closed | Mccluskey Sean M | $206,250 | |
| Open | Mccluskey Sean M | $1,100,000 | |
| Previous Owner | Bogert Dallas D | $650,000 |
Source: Public Records
Tax History Compared to Growth
Tax History
| Year | Tax Paid | Tax Assessment Tax Assessment Total Assessment is a certain percentage of the fair market value that is determined by local assessors to be the total taxable value of land and additions on the property. | Land | Improvement |
|---|---|---|---|---|
| 2025 | $20,999 | $1,095,844 | -- | -- |
| 2024 | $20,439 | $1,063,927 | -- | -- |
| 2023 | $20,439 | $1,032,939 | $0 | $0 |
| 2022 | $19,250 | $1,002,854 | $0 | $0 |
| 2021 | $17,777 | $973,645 | $0 | $0 |
| 2020 | $17,331 | $945,287 | $0 | $0 |
| 2019 | $16,905 | $917,755 | $0 | $0 |
| 2018 | $16,075 | $891,024 | $0 | $0 |
| 2017 | $15,511 | $865,072 | $0 | $0 |
| 2016 | $14,119 | $839,876 | $0 | $0 |
| 2015 | $13,641 | $815,414 | $0 | $0 |
| 2014 | $13,465 | $791,664 | $0 | $0 |
Source: Public Records
Map
Nearby Homes
- 1527 Lake Front Rd
- 1865 Palisades Lake Ct
- 1872 Palisades Terrace Dr
- 1725 Southshore Blvd
- 719 SW Maple St
- 919 Westpoint Rd
- 1710 S Shore Blvd
- 16081 Pearcy St
- 1130 Laurel St
- 1247 Spruce St
- 1206 Cedar St
- 630 Ridgeway Rd
- 1225 Spruce St
- 1720 Kilkenny Dr
- 589 Ridgeway Rd
- 1535 Larch St
- 852 Northshore Rd
- 800 Terrace Dr
- 408 Ridgeway Rd
- 1405 Cherry Crest Ave