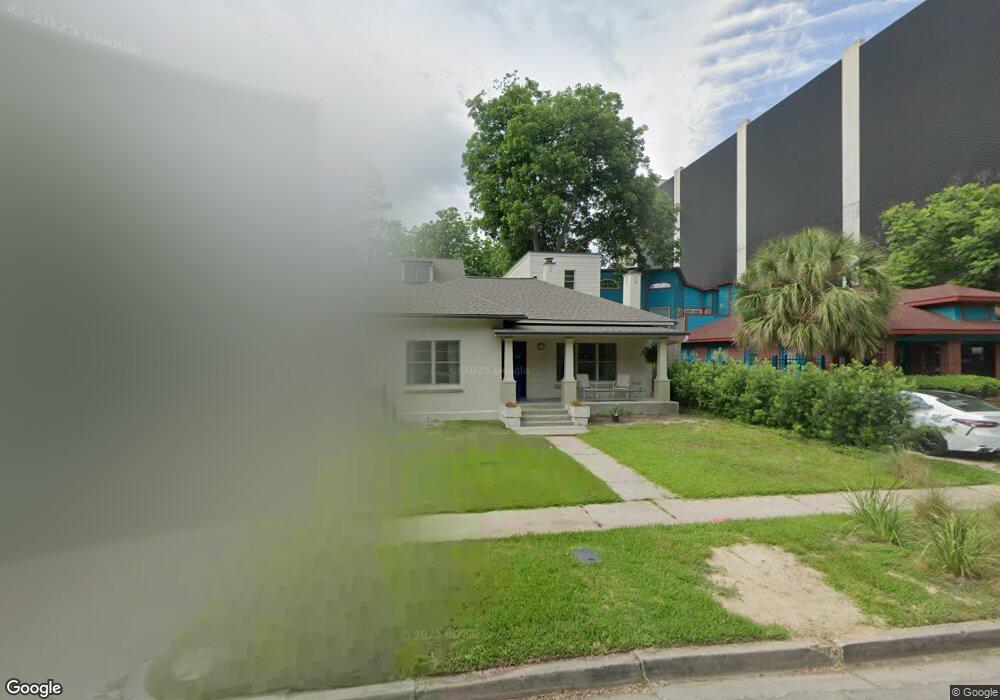
1637 Sul Ross St Houston, TX 77006
Montrose NeighborhoodEstimated Value: $681,000 - $993,000
2
Beds
1
Bath
1,154
Sq Ft
$745/Sq Ft
Est. Value
About This Home
This home is located at 1637 Sul Ross St, Houston, TX 77006 and is currently estimated at $860,291, approximately $745 per square foot. 1637 Sul Ross St is a home located in Harris County with nearby schools including Baker Montessori, Lanier Middle School, and Lamar High School.
Ownership History
Date
Name
Owned For
Owner Type
Purchase Details
Closed on
Aug 5, 2015
Sold by
Randall Diana L
Bought by
Rose Howard A and Rose Karen M
Current Estimated Value
Home Financials for this Owner
Home Financials are based on the most recent Mortgage that was taken out on this home.
Original Mortgage
$356,250
Outstanding Balance
$278,943
Interest Rate
4.06%
Mortgage Type
New Conventional
Estimated Equity
$581,348
Purchase Details
Closed on
Mar 24, 2004
Sold by
Lipscomb Sarah Dabney
Bought by
Randall Diana L
Home Financials for this Owner
Home Financials are based on the most recent Mortgage that was taken out on this home.
Original Mortgage
$172,466
Interest Rate
5.64%
Mortgage Type
Purchase Money Mortgage
Purchase Details
Closed on
Aug 29, 2001
Sold by
Harger Robert Dale
Bought by
Lipscomb Sarah Dabney
Purchase Details
Closed on
May 31, 1996
Sold by
Lipscomb Sarah Dabney
Bought by
Harger Robert D
Create a Home Valuation Report for This Property
The Home Valuation Report is an in-depth analysis detailing your home's value as well as a comparison with similar homes in the area
Home Values in the Area
Average Home Value in this Area
Purchase History
| Date | Buyer | Sale Price | Title Company |
|---|---|---|---|
| Rose Howard A | -- | Veritas Title Partners | |
| Randall Diana L | -- | Stewart Title Company | |
| Lipscomb Sarah Dabney | -- | Stewart Title | |
| Harger Robert D | -- | -- |
Source: Public Records
Mortgage History
| Date | Status | Borrower | Loan Amount |
|---|---|---|---|
| Open | Rose Howard A | $356,250 | |
| Previous Owner | Randall Diana L | $172,466 |
Source: Public Records
Tax History Compared to Growth
Tax History
| Year | Tax Paid | Tax Assessment Tax Assessment Total Assessment is a certain percentage of the fair market value that is determined by local assessors to be the total taxable value of land and additions on the property. | Land | Improvement |
|---|---|---|---|---|
| 2025 | $9,516 | $940,451 | $750,000 | $190,451 |
| 2024 | $9,516 | $850,000 | $687,500 | $162,500 |
| 2023 | $9,516 | $951,300 | $687,500 | $263,800 |
| 2022 | $17,772 | $807,103 | $500,000 | $307,103 |
| 2021 | $14,228 | $610,468 | $500,000 | $110,468 |
| 2020 | $12,672 | $523,288 | $500,000 | $23,288 |
| 2019 | $13,043 | $515,456 | $500,000 | $15,456 |
| 2018 | $12,601 | $497,975 | $468,750 | $29,225 |
| 2017 | $12,969 | $488,750 | $468,750 | $20,000 |
| 2016 | $11,774 | $443,693 | $406,250 | $37,443 |
| 2015 | $7,026 | $237,664 | $203,125 | $34,539 |
| 2014 | $7,026 | $273,312 | $171,875 | $101,437 |
Source: Public Records
Map
Nearby Homes
- 1638 W Alabama St
- 1612 W Alabama St Unit ABCD
- 1634 Marshall St
- 3705 Mandell St Unit 8
- 1531 Marshall St Unit 3
- 1615 W Main St
- 1723 Marshall St
- 1512 W Alabama St
- 1612 Kipling St
- 1648 Colquitt St
- 1660 Kipling St
- 1737 Branard St
- 1510 Marshall St
- 1517 Kipling St
- 1511 Kipling St
- 1507 Kipling St
- 1620 Harold St
- 1620, 1624 & 1630 Richmond Ave
- 1648 Richmond Ave
- 1721 Colquitt St
- 1639 Sul Ross St
- 1635 Sul Ross St
- 1623 Sul Ross St
- 1636 Branard St
- 1638 Branard St
- 1634 Branard St
- 1634 Branard St Unit 1/2
- 1634 Branard St
- 1621 Sul Ross St
- 1628 Branard St
- 1636 Sul Ross St
- 1624 Branard St
- 1640 Sul Ross St
- 1617 Sul Ross St
- 1632 Sul Ross St Unit 1
- 1632 Sul Ross St
- 1628 Sul Ross St
- 1618 Branard St
- 1624 Sul Ross St
- 1615 Sul Ross St