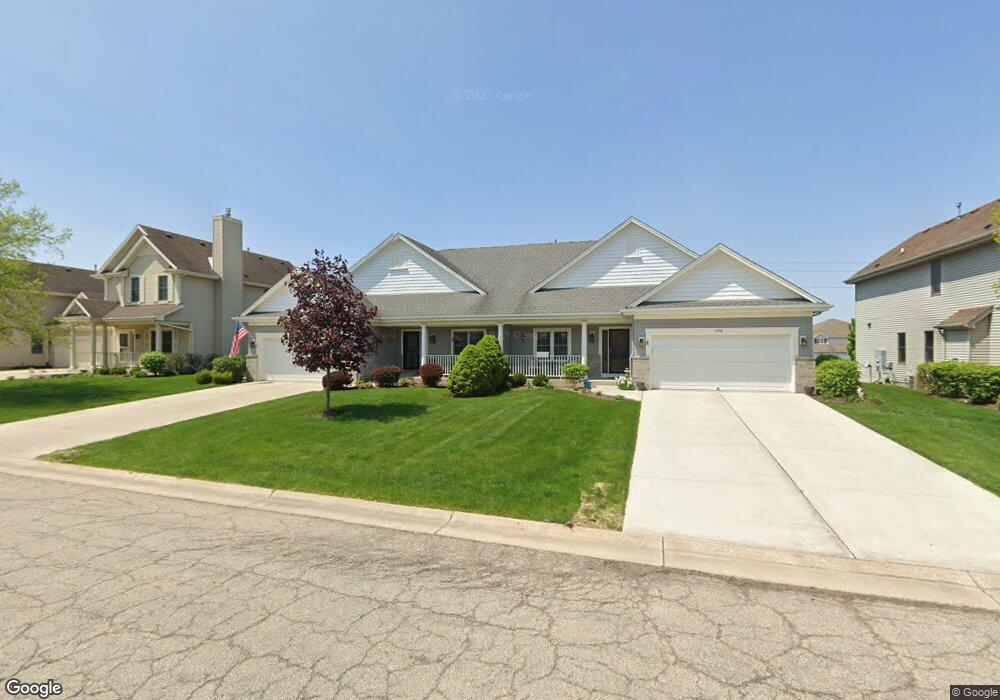
1638 Raintree Ln Mount Pleasant, WI 53406
Estimated Value: $284,000 - $354,000
3
Beds
3
Baths
1,280
Sq Ft
$258/Sq Ft
Est. Value
About This Home
This home is located at 1638 Raintree Ln, Mount Pleasant, WI 53406 and is currently estimated at $329,834, approximately $257 per square foot. 1638 Raintree Ln is a home located in Racine County with nearby schools including Gifford Elementary School, Case High School, and Racine Christian School.
Ownership History
Date
Name
Owned For
Owner Type
Purchase Details
Closed on
Mar 22, 2022
Sold by
Iggulden Michael A and Iggulden Marsha L
Bought by
Iggulden Michael A and Iggulden Marsha L
Current Estimated Value
Purchase Details
Closed on
Dec 23, 2014
Sold by
Kaad John E and Alt Melissa Kay
Bought by
Iggulden Michael A and Iggulden Marsha L
Purchase Details
Closed on
Apr 17, 2012
Sold by
Anderson Sheila K and White Sheila K
Bought by
Key Kaad John E and Key Ait Melissa
Home Financials for this Owner
Home Financials are based on the most recent Mortgage that was taken out on this home.
Original Mortgage
$134,000
Interest Rate
4%
Mortgage Type
Purchase Money Mortgage
Purchase Details
Closed on
Oct 17, 2005
Sold by
K Corp Of Racine
Bought by
White Sheila K
Create a Home Valuation Report for This Property
The Home Valuation Report is an in-depth analysis detailing your home's value as well as a comparison with similar homes in the area
Home Values in the Area
Average Home Value in this Area
Purchase History
| Date | Buyer | Sale Price | Title Company |
|---|---|---|---|
| Iggulden Michael A | -- | None Listed On Document | |
| Iggulden Michael A | $175,000 | None Available | |
| Key Kaad John E | $167,000 | None Available | |
| White Sheila K | $210,230 | -- |
Source: Public Records
Mortgage History
| Date | Status | Borrower | Loan Amount |
|---|---|---|---|
| Previous Owner | Key Kaad John E | $134,000 |
Source: Public Records
Tax History Compared to Growth
Tax History
| Year | Tax Paid | Tax Assessment Tax Assessment Total Assessment is a certain percentage of the fair market value that is determined by local assessors to be the total taxable value of land and additions on the property. | Land | Improvement |
|---|---|---|---|---|
| 2024 | $2,654 | $334,100 | $25,900 | $308,200 |
| 2023 | $5,635 | $335,500 | $24,200 | $311,300 |
| 2022 | $5,144 | $305,400 | $24,200 | $281,200 |
| 2021 | $5,703 | $300,800 | $22,000 | $278,800 |
| 2020 | $4,523 | $233,700 | $20,000 | $213,700 |
| 2019 | $4,338 | $233,700 | $20,000 | $213,700 |
| 2018 | $4,025 | $201,800 | $20,000 | $181,800 |
| 2017 | $3,784 | $188,100 | $20,000 | $168,100 |
| 2016 | $3,722 | $174,300 | $20,000 | $154,300 |
| 2015 | $3,667 | $174,300 | $20,000 | $154,300 |
| 2014 | $3,464 | $174,300 | $20,000 | $154,300 |
| 2013 | $3,679 | $174,300 | $20,000 | $154,300 |
Source: Public Records
Map
Nearby Homes
- 7131 Fieldview Dr
- 1517 Summerset Dr Unit 83
- 7136 Parkside Ln Unit 122
- 6516 Primrose Way
- 6510 Spring St Unit 17
- 2314 Raintree Ln
- 1315 N Sunnyslope Dr Unit 202
- 1208 N Sunnyslope Dr Unit 202
- 2421 Dover Ln
- 1203 N Sunnyslope Dr Unit 101
- 6147 Carriage Hills Dr
- 1117 N Sunnyslope Dr Unit 202
- 1117 N Sunnyslope Dr Unit 204
- 6121 Spring St
- 6300 Bald Eagle Rd
- 6236 Bald Eagle Rd
- 38 S Emmertsen Rd
- 5820 Cambridge Ln Unit 7
- 5616 Cambridge Ln Unit 5
- 5835 Cambridge Cir Unit 5
- 1636 Raintree Ln
- 1642 Raintree Ln Unit 2
- 1644 Raintree Ln Unit 1
- 1630 Raintree Ln Unit 6
- 1632 Raintree Ln Unit 5
- 1624 Raintree Ln Unit 8
- 1626 Raintree Ln Unit 7
- 1734 Raintree Ln Unit 48
- 1736 Raintree Ln Unit 47
- 1639 Raintree Ln Unit 30
- 1637 Raintree Ln Unit 29
- 1645 Raintree Ln Unit 32
- 1643 Raintree Ln Unit 31
- 1633 Raintree Ln Unit 28
- 1631 Raintree Ln Unit 27
- 1618 Raintree Ln
- 1620 Raintree Ln Unit 9
- 1627 Raintree Ln Unit 26
- 1625 Raintree Ln Unit 25
- 1635 Summerset Dr