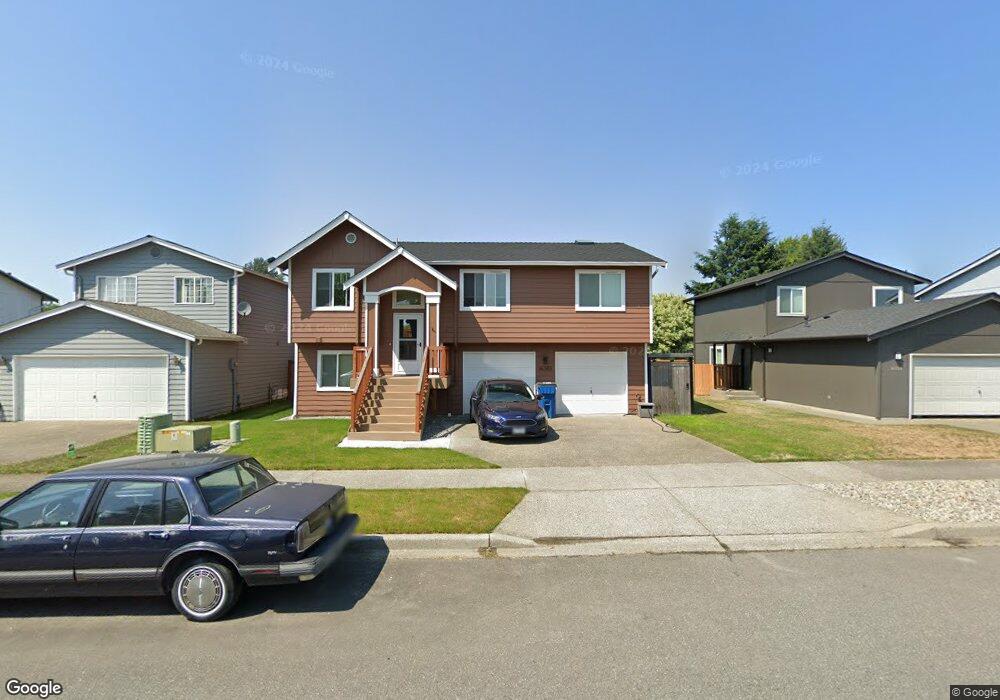
16383 156th St SE Monroe, WA 98272
Estimated Value: $637,000 - $713,000
3
Beds
3
Baths
1,722
Sq Ft
$383/Sq Ft
Est. Value
About This Home
This home is located at 16383 156th St SE, Monroe, WA 98272 and is currently estimated at $659,893, approximately $383 per square foot. 16383 156th St SE is a home located in Snohomish County with nearby schools including Fryelands Elementary School, Monroe High School, and Monroe Christian School.
Ownership History
Date
Name
Owned For
Owner Type
Purchase Details
Closed on
Dec 10, 1998
Sold by
Yinn Antaravuth
Bought by
Cochran Douglas M and Cochran Mary C
Current Estimated Value
Home Financials for this Owner
Home Financials are based on the most recent Mortgage that was taken out on this home.
Original Mortgage
$170,950
Interest Rate
6.78%
Purchase Details
Closed on
Dec 2, 1997
Sold by
Dream Starter Homes Inc
Bought by
Yinn Antaravuth
Home Financials for this Owner
Home Financials are based on the most recent Mortgage that was taken out on this home.
Original Mortgage
$142,076
Interest Rate
7.31%
Purchase Details
Closed on
Jun 20, 1997
Sold by
Mastro Michael R
Bought by
Dream Starter Homes Inc
Home Financials for this Owner
Home Financials are based on the most recent Mortgage that was taken out on this home.
Original Mortgage
$96,000
Interest Rate
7.94%
Create a Home Valuation Report for This Property
The Home Valuation Report is an in-depth analysis detailing your home's value as well as a comparison with similar homes in the area
Home Values in the Area
Average Home Value in this Area
Purchase History
| Date | Buyer | Sale Price | Title Company |
|---|---|---|---|
| Cochran Douglas M | $179,950 | Transnation Title Insurance | |
| Yinn Antaravuth | -- | -- | |
| Yinn Antaravuth | $145,000 | -- | |
| Dream Starter Homes Inc | $43,500 | Pacific Northwest Title Co |
Source: Public Records
Mortgage History
| Date | Status | Borrower | Loan Amount |
|---|---|---|---|
| Previous Owner | Cochran Douglas M | $170,950 | |
| Previous Owner | Yinn Antaravuth | $142,076 | |
| Previous Owner | Dream Starter Homes Inc | $96,000 | |
| Closed | Dream Starter Homes Inc | $11,600 |
Source: Public Records
Tax History Compared to Growth
Tax History
| Year | Tax Paid | Tax Assessment Tax Assessment Total Assessment is a certain percentage of the fair market value that is determined by local assessors to be the total taxable value of land and additions on the property. | Land | Improvement |
|---|---|---|---|---|
| 2025 | $4,954 | $610,500 | $304,000 | $306,500 |
| 2024 | $4,709 | $581,700 | $289,000 | $292,700 |
| 2023 | $4,641 | $621,900 | $319,000 | $302,900 |
| 2022 | $4,263 | $455,700 | $213,000 | $242,700 |
| 2020 | $3,888 | $400,600 | $188,000 | $212,600 |
| 2019 | $3,687 | $375,000 | $178,000 | $197,000 |
| 2018 | $4,015 | $334,700 | $148,000 | $186,700 |
| 2017 | $3,429 | $299,000 | $125,000 | $174,000 |
| 2016 | $3,544 | $284,400 | $103,000 | $181,400 |
| 2015 | $3,451 | $260,600 | $89,000 | $171,600 |
| 2013 | $2,765 | $190,900 | $73,000 | $117,900 |
Source: Public Records
Map
Nearby Homes
- 15648 Lakeview Ave SE
- 15111 167th Ave SE
- 16625 Ladd St SE
- 16096 Roma Dr SE
- 23311 165th Ave SE
- 16951 Tulip Ln
- 16855 Wales St SE
- 17284 157th St SE
- 15217 172nd Ave SE
- 17342 Mountain View Rd SE
- 15087 172nd Ave SE
- 16449 169th St SE Unit 16449
- 16673 167th Ave SE Unit 16673
- 17417 W Main St Unit E101
- 17510 W Main St Unit C103
- 16311 177th Ave SE
- 17856 152nd St SE
- 17795 149th St SE Unit 9
- 17815 149th St SE Unit 14
- 17803 149th St SE Unit 11
- 16369 156th St SE
- 16399 156th St SE
- 16351 156th St SE
- 15553 Heintz Ave SE
- 15531 Heintz Ave SE
- 16427 156th St SE
- 16376 156th St SE
- 16392 156th St SE
- 16354 156th St SE
- 16408 156th St SE
- 16443 156th St SE
- 15548 Heintz Ave SE
- 16422 156th St SE
- 15507 Heintz Ave SE
- 16436 155th St SE
- 25497 Heintz Ave SE
- 16459 156th St SE
- 16438 156th St SE
- 16452 155th St SE
- 16454 156th St SE