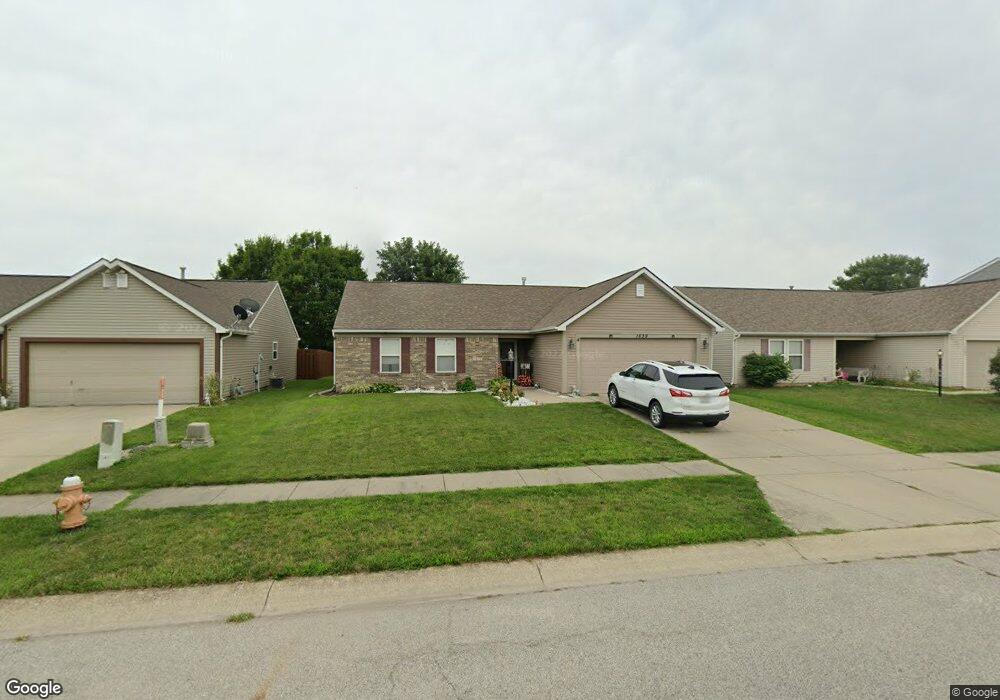
1639 Austin Dr Lebanon, IN 46052
Estimated Value: $268,000 - $276,000
3
Beds
2
Baths
1,402
Sq Ft
$194/Sq Ft
Est. Value
About This Home
This home is located at 1639 Austin Dr, Lebanon, IN 46052 and is currently estimated at $271,827, approximately $193 per square foot. 1639 Austin Dr is a home located in Boone County with nearby schools including Harney Elementary School, Lebanon Middle School, and Lebanon Senior High School.
Ownership History
Date
Name
Owned For
Owner Type
Purchase Details
Closed on
Dec 2, 2013
Sold by
Perkins Craig Allen and Perkins Amber Renee
Bought by
Sheets Jon M and Sheets Linda L
Current Estimated Value
Home Financials for this Owner
Home Financials are based on the most recent Mortgage that was taken out on this home.
Original Mortgage
$123,717
Outstanding Balance
$94,131
Interest Rate
4.75%
Mortgage Type
FHA
Estimated Equity
$177,696
Purchase Details
Closed on
Nov 21, 2007
Sold by
Jackson Alphonso and Secretary Of Hud
Bought by
Perkins Craig Allen and Perkins Amber Renee
Home Financials for this Owner
Home Financials are based on the most recent Mortgage that was taken out on this home.
Original Mortgage
$111,500
Interest Rate
6.47%
Mortgage Type
New Conventional
Purchase Details
Closed on
Jul 16, 2007
Sold by
National City Bank
Bought by
Secretary Of Hud
Purchase Details
Closed on
Jun 21, 2007
Sold by
Hengen Michael W
Bought by
National City Bank
Create a Home Valuation Report for This Property
The Home Valuation Report is an in-depth analysis detailing your home's value as well as a comparison with similar homes in the area
Home Values in the Area
Average Home Value in this Area
Purchase History
| Date | Buyer | Sale Price | Title Company |
|---|---|---|---|
| Sheets Jon M | -- | Royal Title Services | |
| Perkins Craig Allen | -- | -- | |
| Secretary Of Hud | -- | -- | |
| National City Bank | -- | -- |
Source: Public Records
Mortgage History
| Date | Status | Borrower | Loan Amount |
|---|---|---|---|
| Open | Sheets Jon M | $123,717 | |
| Previous Owner | Perkins Craig Allen | $111,500 |
Source: Public Records
Tax History Compared to Growth
Tax History
| Year | Tax Paid | Tax Assessment Tax Assessment Total Assessment is a certain percentage of the fair market value that is determined by local assessors to be the total taxable value of land and additions on the property. | Land | Improvement |
|---|---|---|---|---|
| 2025 | $2,434 | $252,600 | $21,200 | $231,400 |
| 2024 | $2,434 | $238,200 | $21,200 | $217,000 |
| 2023 | $2,266 | $229,600 | $21,200 | $208,400 |
| 2022 | $2,170 | $211,900 | $21,200 | $190,700 |
| 2021 | $1,874 | $183,600 | $21,200 | $162,400 |
| 2020 | $1,712 | $172,100 | $21,200 | $150,900 |
| 2019 | $1,362 | $151,200 | $21,200 | $130,000 |
| 2018 | $1,380 | $145,900 | $21,200 | $124,700 |
| 2017 | $1,176 | $133,500 | $21,200 | $112,300 |
| 2016 | $1,183 | $130,200 | $21,200 | $109,000 |
| 2014 | $1,048 | $120,100 | $21,200 | $98,900 |
| 2013 | $963 | $116,700 | $21,200 | $95,500 |
Source: Public Records
Map
Nearby Homes
- 2116 Crimson Ln
- 1606 Ashley Dr
- 1711 Lafayette Ave Unit 8
- 1711 Lafayette Ave Unit 19
- 857 Sunchaser Rd
- 841 Sunchaser Rd
- 2114 Yosemite Dr
- 2127 Yosemite Dr
- 1540 Round Lake Ct
- 960 Red Hills Ct
- 1711 Jaques Dr
- 1410 Danielle Rd
- 1530 Citation Cir N
- 2640 Stonebridge Dr
- 1336 Danielle Rd
- 1624 Riley Rd
- 2751 Sand Hollow Dr
- 1325 W Camp St
- 105 Kelli Ct
- 135 Westmoor Dr
- 1629 Austin Dr
- 1705 Austin Dr
- 1717 Austin Dr
- 1700 Clover Ln
- 1617 Austin Dr
- 1706 Clover Ln
- 1630 Clover Ln
- 1704 Austin Dr
- 1712 Austin Dr
- 1731 Austin Dr
- 1714 Clover Ln
- 1618 Clover Ln
- 1620 Austin Dr
- 1628 Austin Dr
- 1733 Austin Dr
- 1616 Austin Dr
- 1616 Austin Dr Unit 117
- 1724 Austin Dr
- 2127 Crimson Ln
- 1730 Clover Ln