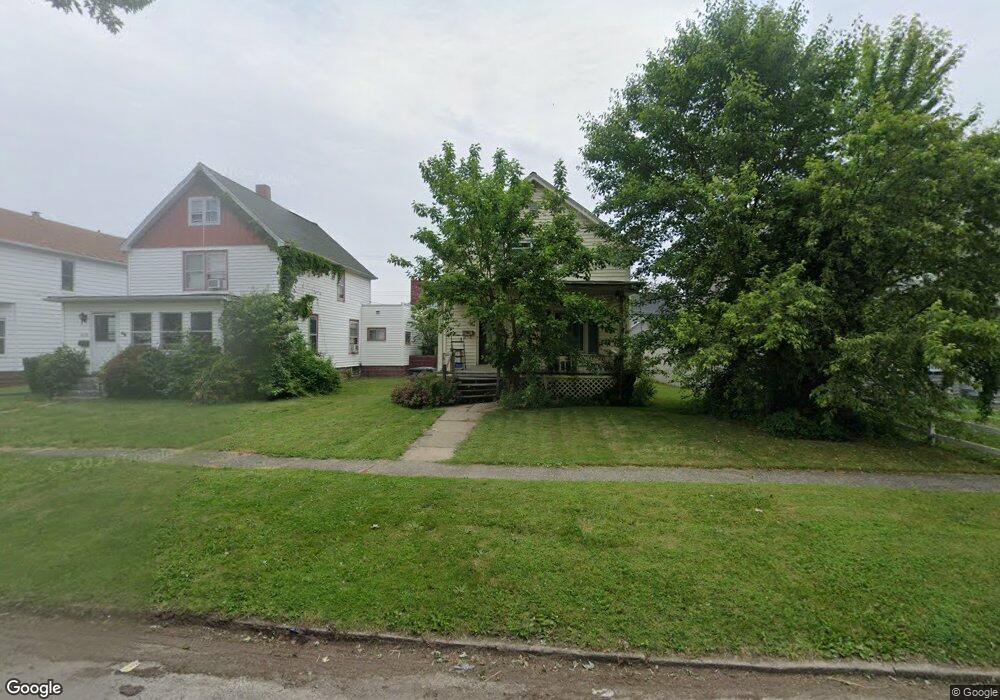
1639 E 47th St Ashtabula, OH 44004
Estimated Value: $79,000 - $125,000
3
Beds
1
Bath
960
Sq Ft
$98/Sq Ft
Est. Value
About This Home
This home is located at 1639 E 47th St, Ashtabula, OH 44004 and is currently estimated at $94,551, approximately $98 per square foot. 1639 E 47th St is a home located in Ashtabula County with nearby schools including Lakeside High School and Christian Faith Academy.
Ownership History
Date
Name
Owned For
Owner Type
Purchase Details
Closed on
Oct 31, 2006
Sold by
Bennett Ward and Bennett Ward E
Bought by
Huffman Aaron M and Huffman Stephanie M
Current Estimated Value
Home Financials for this Owner
Home Financials are based on the most recent Mortgage that was taken out on this home.
Original Mortgage
$72,923
Outstanding Balance
$43,714
Interest Rate
6.45%
Mortgage Type
FHA
Estimated Equity
$50,837
Purchase Details
Closed on
Apr 8, 2004
Sold by
Citifinancial Mortgage Co Inc
Bought by
Bennett Ward
Purchase Details
Closed on
May 1, 2003
Sold by
Budy Albert W and Budy Linda R
Bought by
Citifinancial Mortgage Co Inc
Create a Home Valuation Report for This Property
The Home Valuation Report is an in-depth analysis detailing your home's value as well as a comparison with similar homes in the area
Home Values in the Area
Average Home Value in this Area
Purchase History
| Date | Buyer | Sale Price | Title Company |
|---|---|---|---|
| Huffman Aaron M | $73,200 | Franklin Blair Title Agency | |
| Bennett Ward | $31,000 | Accutitle Agency Inc | |
| Citifinancial Mortgage Co Inc | $56,800 | -- |
Source: Public Records
Mortgage History
| Date | Status | Borrower | Loan Amount |
|---|---|---|---|
| Open | Huffman Aaron M | $72,923 |
Source: Public Records
Tax History
| Year | Tax Paid | Tax Assessment Tax Assessment Total Assessment is a certain percentage of the fair market value that is determined by local assessors to be the total taxable value of land and additions on the property. | Land | Improvement |
|---|---|---|---|---|
| 2024 | $1,816 | $21,140 | $4,830 | $16,310 |
| 2023 | $1,088 | $21,140 | $4,830 | $16,310 |
| 2022 | $904 | $15,370 | $3,710 | $11,660 |
| 2021 | $2,252 | $15,370 | $3,710 | $11,660 |
| 2020 | $925 | $15,370 | $3,710 | $11,660 |
| 2019 | $1,194 | $19,080 | $4,170 | $14,910 |
| 2018 | $1,084 | $19,080 | $4,170 | $14,910 |
| 2017 | $1,037 | $19,080 | $4,170 | $14,910 |
| 2016 | $1,019 | $17,190 | $3,750 | $13,440 |
| 2015 | $992 | $17,190 | $3,750 | $13,440 |
| 2014 | $967 | $17,190 | $3,750 | $13,440 |
| 2013 | $969 | $18,480 | $3,780 | $14,700 |
Source: Public Records
Map
Nearby Homes
- 1629 E 47th St
- 4422 State Rd
- 4320 Birchwood Ave
- 4211 Birchwood Ave
- 5031 Blakeslee Ave
- 4422 Rodgers Rd
- 1626 #165 E 51st St
- 1626 132 E 51st St
- 183 1626 E 51st St
- 2130 E 44th St
- 1930 E 52nd St
- 4016 State Rd
- 4211 Park Ave
- 2124 E 40th St
- 137 Grove Dr
- 5725 Main Ave
- 320 Fox Dr
- 211 W 58th St
- 5522 Adams Ave
- 5425 Adams Ave
Your Personal Tour Guide
Ask me questions while you tour the home.