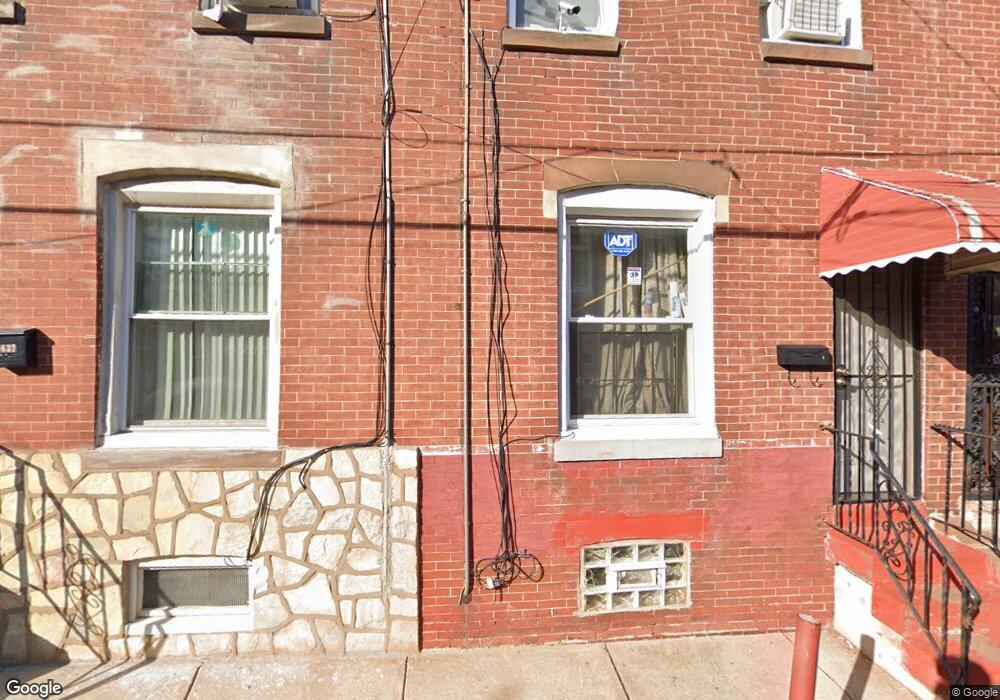
1639 Fillmore St Philadelphia, PA 19124
Frankford NeighborhoodEstimated Value: $114,000 - $121,000
2
Beds
1
Bath
1,008
Sq Ft
$117/Sq Ft
Est. Value
About This Home
This home is located at 1639 Fillmore St, Philadelphia, PA 19124 and is currently estimated at $117,656, approximately $116 per square foot. 1639 Fillmore St is a home located in Philadelphia County with nearby schools including Harding Warren G Middle School, Frankford High School, and Mastery Schools Smedley Elementary.
Ownership History
Date
Name
Owned For
Owner Type
Purchase Details
Closed on
Jan 15, 2010
Sold by
Thorpe Robert J
Bought by
Phipps Gary
Current Estimated Value
Home Financials for this Owner
Home Financials are based on the most recent Mortgage that was taken out on this home.
Original Mortgage
$51,548
Outstanding Balance
$34,643
Interest Rate
5.5%
Mortgage Type
FHA
Estimated Equity
$83,013
Purchase Details
Closed on
Jan 7, 2003
Sold by
Demarco Drew
Bought by
Kelly John L
Home Financials for this Owner
Home Financials are based on the most recent Mortgage that was taken out on this home.
Original Mortgage
$32,965
Interest Rate
6.19%
Purchase Details
Closed on
Jul 18, 2002
Sold by
Bankers Trust Company
Bought by
Demarco Drew
Purchase Details
Closed on
Jul 15, 2002
Sold by
Mazur Jeffrey
Bought by
Bankers Trust Company and Amresco Residential Securities Corp Mtg
Purchase Details
Closed on
Jul 25, 1997
Sold by
Duguay Raymond L
Bought by
Mazur Jeffrey
Create a Home Valuation Report for This Property
The Home Valuation Report is an in-depth analysis detailing your home's value as well as a comparison with similar homes in the area
Home Values in the Area
Average Home Value in this Area
Purchase History
| Date | Buyer | Sale Price | Title Company |
|---|---|---|---|
| Phipps Gary | $52,500 | None Available | |
| Kelly John L | $34,700 | First American Title Ins Co | |
| Demarco Drew | $15,000 | -- | |
| Bankers Trust Company | $12,300 | -- | |
| Mazur Jeffrey | $13,000 | Lawyers Title Insurance Co |
Source: Public Records
Mortgage History
| Date | Status | Borrower | Loan Amount |
|---|---|---|---|
| Open | Phipps Gary | $51,548 | |
| Previous Owner | Kelly John L | $32,965 |
Source: Public Records
Tax History Compared to Growth
Tax History
| Year | Tax Paid | Tax Assessment Tax Assessment Total Assessment is a certain percentage of the fair market value that is determined by local assessors to be the total taxable value of land and additions on the property. | Land | Improvement |
|---|---|---|---|---|
| 2026 | $983 | $101,700 | $20,340 | $81,360 |
| 2025 | $983 | $101,700 | $20,340 | $81,360 |
| 2024 | $983 | $101,700 | $20,340 | $81,360 |
| 2023 | $983 | $70,200 | $14,040 | $56,160 |
| 2022 | $630 | $70,200 | $14,040 | $56,160 |
| 2021 | $630 | $0 | $0 | $0 |
| 2020 | $630 | $0 | $0 | $0 |
| 2019 | $605 | $0 | $0 | $0 |
| 2018 | $679 | $0 | $0 | $0 |
| 2017 | $679 | $0 | $0 | $0 |
| 2016 | $679 | $0 | $0 | $0 |
| 2015 | $765 | $0 | $0 | $0 |
| 2014 | -- | $57,100 | $10,051 | $47,049 |
| 2012 | -- | $4,128 | $332 | $3,796 |
Source: Public Records
Map
Nearby Homes
- 1636 Fillmore St
- 1629 Foulkrod St
- 1615 Fillmore St
- 1688 Fillmore St
- 4735 Frankford Ave
- 4839 Griscom St
- 4843 Duffield St
- 1636 Margaret St
- 1519 Foulkrod St
- 4814 Griscom St
- 1626 Margaret St
- 1515 Foulkrod St
- 1724 Harrison St
- 4714 Hawthorne St
- 4734 44 Oxford Ave
- 4712 Griscom St
- 4666 Duffield St
- 4943 Duffield St
- 4925 Penn St
- 1516 Arrott St
- 1637 Fillmore St
- 1641 Fillmore St
- 1635 Fillmore St
- 1643 Fillmore St
- 1645 Fillmore St
- 1633 Fillmore St
- 1647 Fillmore St
- 1631 Fillmore St
- 1649 Fillmore St
- 1638 Fillmore St
- 1629 Fillmore St
- 1640 Fillmore St
- 1627 Fillmore St
- 1642 Fillmore St
- 1644 Fillmore St
- 1630 Fillmore St
- 1634 Fillmore St
- 1625 Fillmore St
- 1646 Fillmore St
- 4828 Darrah St