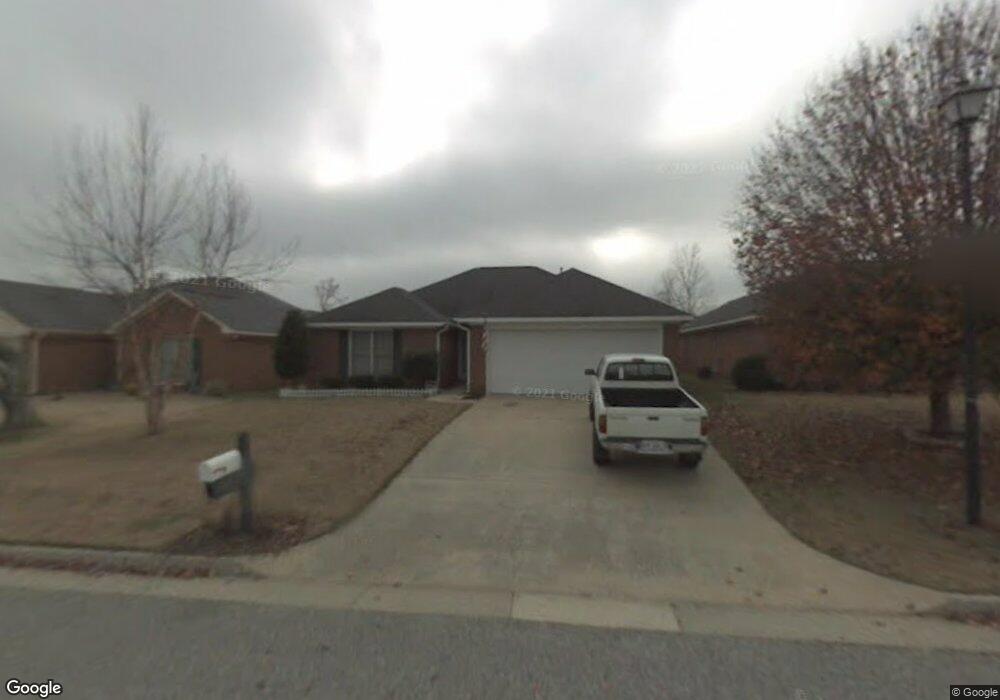
1639 N Grove Ct Columbus, GA 31904
Northern Columbus NeighborhoodEstimated Value: $244,000 - $259,000
3
Beds
2
Baths
1,624
Sq Ft
$156/Sq Ft
Est. Value
About This Home
This home is located at 1639 N Grove Ct, Columbus, GA 31904 and is currently estimated at $253,059, approximately $155 per square foot. 1639 N Grove Ct is a home located in Muscogee County with nearby schools including North Columbus Elementary School, Veterans Memorial Middle School, and Northside High School.
Ownership History
Date
Name
Owned For
Owner Type
Purchase Details
Closed on
Mar 14, 2024
Sold by
Dykes Jason Dawayne
Bought by
Family Snowball Llc
Current Estimated Value
Purchase Details
Closed on
Jul 15, 2019
Sold by
Goodman Michael P
Bought by
Miller Kira
Purchase Details
Closed on
Oct 14, 2011
Sold by
Conklin Curtis
Bought by
Goodman Michael P
Home Financials for this Owner
Home Financials are based on the most recent Mortgage that was taken out on this home.
Original Mortgage
$158,332
Interest Rate
4.16%
Mortgage Type
VA
Create a Home Valuation Report for This Property
The Home Valuation Report is an in-depth analysis detailing your home's value as well as a comparison with similar homes in the area
Home Values in the Area
Average Home Value in this Area
Purchase History
| Date | Buyer | Sale Price | Title Company |
|---|---|---|---|
| Family Snowball Llc | $75,000 | None Listed On Document | |
| Miller Kira | $167,000 | -- | |
| Goodman Michael P | $155,000 | -- |
Source: Public Records
Mortgage History
| Date | Status | Borrower | Loan Amount |
|---|---|---|---|
| Previous Owner | Goodman Michael P | $158,332 |
Source: Public Records
Tax History Compared to Growth
Tax History
| Year | Tax Paid | Tax Assessment Tax Assessment Total Assessment is a certain percentage of the fair market value that is determined by local assessors to be the total taxable value of land and additions on the property. | Land | Improvement |
|---|---|---|---|---|
| 2025 | $1,759 | $83,772 | $10,396 | $73,376 |
| 2024 | $176 | $83,772 | $10,396 | $73,376 |
| 2023 | $1,075 | $83,772 | $10,396 | $73,376 |
| 2022 | $1,833 | $69,376 | $10,396 | $58,980 |
| 2021 | $1,826 | $58,116 | $10,396 | $47,720 |
| 2020 | $1,827 | $58,116 | $10,396 | $47,720 |
| 2019 | $2,409 | $58,808 | $10,396 | $48,412 |
| 2018 | $2,409 | $58,808 | $10,396 | $48,412 |
| 2017 | $2,417 | $58,808 | $10,396 | $48,412 |
| 2016 | $2,558 | $62,000 | $7,450 | $54,550 |
| 2015 | $2,561 | $62,000 | $7,450 | $54,550 |
| 2014 | $2,564 | $62,000 | $7,450 | $54,550 |
| 2013 | -- | $62,000 | $7,450 | $54,550 |
Source: Public Records
Map
Nearby Homes
- 1579 Magnolia Way
- 1727 Fountain Ct
- 1535 Doubletree Dr
- 8344 Twin Chapel Dr
- 7170 Bridgemill Dr
- 1058 Cedarbrook Dr
- 7995 Big Creek Place
- 928 Heiferhorn Trace
- 1438 Grove Park Dr Unit 13B
- 1719 Double Churches Rd
- 8259 Lantern Ln
- 7701 Gray Shoals Dr
- 7841 Edgewater Dr
- 7407 Peppercorn Dr
- 7635 Edgewater Dr
- 7559 Crescent Dr
- 7313 Sesame St
- 1049 Red Maple Way
- 8008 Lagoon Ct
- 1255 Woodville Ct
- 1643 N Grove Ct
- 1635 N Grove Ct
- 1647 N Grove Ct
- 1631 N Grove Ct
- 8137 Williams Way
- 1640 N Grove Ct
- 1636 N Grove Ct
- 8141 Williams Way
- 8133 Williams Way
- 1644 N Grove Ct
- 8145 Williams Way
- 1651 N Grove Ct
- 1627 N Grove Ct
- 8129 Williams Way
- 1648 N Grove Ct
- 8149 Williams Way
- 1632 N Grove Ct
- 8125 Williams Way
- 1623 N Grove Ct
- 1628 N Grove Ct