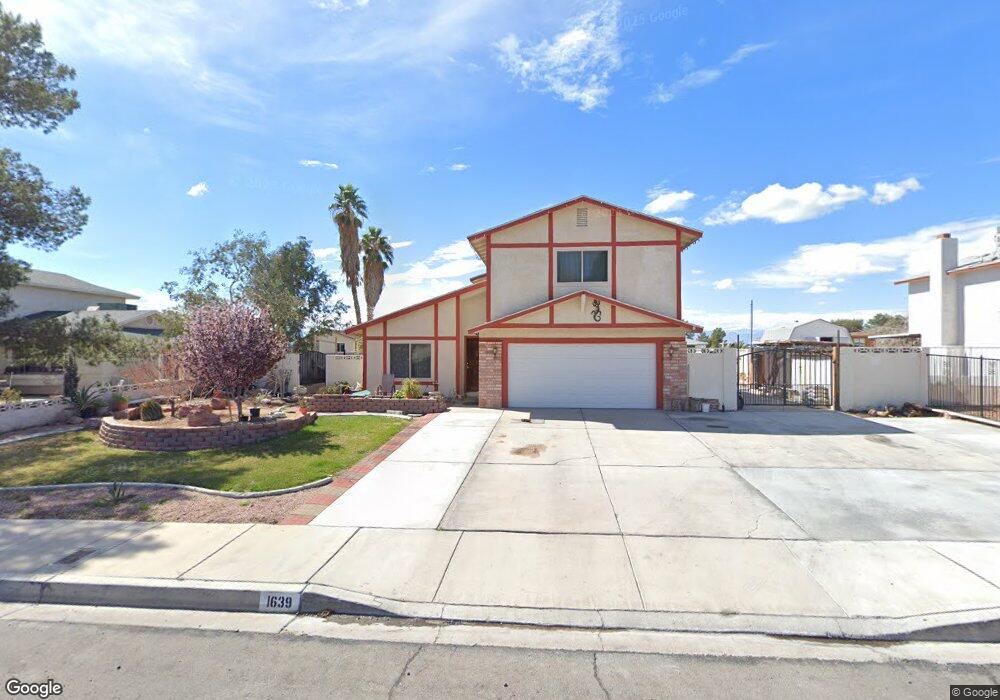
1639 Shatz St Las Vegas, NV 89156
Estimated Value: $442,000 - $480,000
3
Beds
3
Baths
1,890
Sq Ft
$242/Sq Ft
Est. Value
About This Home
This home is located at 1639 Shatz St, Las Vegas, NV 89156 and is currently estimated at $458,030, approximately $242 per square foot. 1639 Shatz St is a home located in Clark County with nearby schools including Mountain View Elementary School, Dr. William H. Bailey Middle School, and Sunrise Mountain High School.
Ownership History
Date
Name
Owned For
Owner Type
Purchase Details
Closed on
Oct 9, 2020
Sold by
Angulo Rodrigo Camacho and De Camacho Magdalena
Bought by
Decamacho Magdalena Gomez
Current Estimated Value
Purchase Details
Closed on
Mar 30, 2010
Sold by
The Bank Of New York Mellon
Bought by
Camacho Rodrigo A and Camacho Magdalena
Home Financials for this Owner
Home Financials are based on the most recent Mortgage that was taken out on this home.
Original Mortgage
$112,917
Outstanding Balance
$74,758
Interest Rate
4.88%
Mortgage Type
FHA
Estimated Equity
$383,272
Purchase Details
Closed on
Sep 18, 2009
Sold by
Acosta Arturo and Acosta Viviana
Bought by
The Bank Of New York Mellon and The Bank Of New York
Purchase Details
Closed on
Apr 10, 2003
Sold by
Anderson Cledus M and Anderson Delores
Bought by
Acosta Arturo and Sanchez Viviana
Home Financials for this Owner
Home Financials are based on the most recent Mortgage that was taken out on this home.
Original Mortgage
$156,750
Interest Rate
5.71%
Create a Home Valuation Report for This Property
The Home Valuation Report is an in-depth analysis detailing your home's value as well as a comparison with similar homes in the area
Home Values in the Area
Average Home Value in this Area
Purchase History
| Date | Buyer | Sale Price | Title Company |
|---|---|---|---|
| Decamacho Magdalena Gomez | -- | None Available | |
| Camacho Rodrigo A | $115,000 | First American Title Paseo | |
| The Bank Of New York Mellon | $93,500 | Fidelity National Default So | |
| Acosta Arturo | $166,000 | Fidelity National Title |
Source: Public Records
Mortgage History
| Date | Status | Borrower | Loan Amount |
|---|---|---|---|
| Open | Camacho Rodrigo A | $112,917 | |
| Previous Owner | Acosta Arturo | $156,750 |
Source: Public Records
Tax History Compared to Growth
Tax History
| Year | Tax Paid | Tax Assessment Tax Assessment Total Assessment is a certain percentage of the fair market value that is determined by local assessors to be the total taxable value of land and additions on the property. | Land | Improvement |
|---|---|---|---|---|
| 2025 | $1,408 | $76,448 | $31,150 | $45,298 |
| 2024 | $1,367 | $76,448 | $31,150 | $45,298 |
| 2023 | $1,367 | $76,554 | $32,550 | $44,004 |
| 2022 | $1,455 | $67,176 | $26,250 | $40,926 |
| 2021 | $1,348 | $62,525 | $23,100 | $39,425 |
| 2020 | $1,249 | $62,704 | $23,100 | $39,604 |
| 2019 | $1,170 | $58,112 | $18,550 | $39,562 |
| 2018 | $1,117 | $55,783 | $17,500 | $38,283 |
| 2017 | $1,612 | $54,961 | $15,750 | $39,211 |
| 2016 | $1,046 | $50,920 | $10,850 | $40,070 |
| 2015 | $1,043 | $41,127 | $8,750 | $32,377 |
| 2014 | $1,011 | $33,988 | $7,000 | $26,988 |
Source: Public Records
Map
Nearby Homes
- 6435 Heatherton Ave
- 6271 Brynhurst Dr
- 2085 N Hollywood Blvd
- 1905 Eskam St
- 6182 Morning Splendor Way
- 1713 Eddingham Ct
- 1932 Spindrift Ct
- 1330 Honey Lake St
- 6205 Seaside Park Ave
- 1295 Los Meadows Dr
- 1250 Bobrich Cir
- 1251 Los Meadows Dr
- 2093 Scanlon Ferry Ct Unit 103
- 6201 E Lake Mead Blvd Unit 151
- 6201 E Lake Mead Blvd Unit E218
- 6201 E Lake Mead Blvd Unit 210
- 2087 Arivada Ferry Ct Unit 101
- 5991 Corpus Christi Ct
- 6165 Stanley Park Ave
- 1325 Fairchild St
- 1653 Shatz St
- 1625 Shatz St
- 1630 Rolling Hills Dr
- 1640 Rolling Hills Dr
- 1620 Rolling Hills Dr
- 6506 Mount Palmer Ct
- 1650 Rolling Hills Dr
- 1667 Shatz St
- 1611 Shatz St
- 6521 Monterey Vista Ct
- 1660 Rolling Hills Dr
- 6507 Mount Palmer Ct
- 6518 Mount Palmer Ct
- 1681 Shatz St
- 1671 Monterey Sunrise Dr
- 6531 Monterey Vista Ct
- 1670 Rolling Hills Dr
- 1639 Rolling Hills Dr
- 6519 Mount Palmer Ct