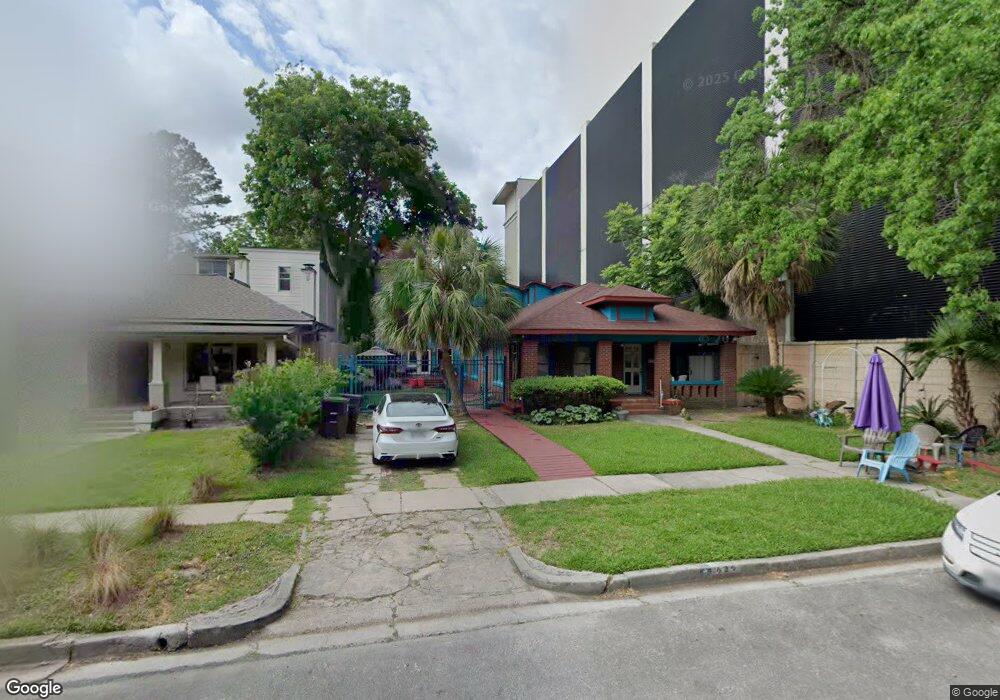
1639 Sul Ross St Houston, TX 77006
Montrose NeighborhoodEstimated Value: $872,000 - $1,292,000
3
Beds
3
Baths
3,842
Sq Ft
$270/Sq Ft
Est. Value
About This Home
This home is located at 1639 Sul Ross St, Houston, TX 77006 and is currently estimated at $1,037,236, approximately $269 per square foot. 1639 Sul Ross St is a home located in Harris County with nearby schools including Baker Montessori, Lanier Middle School, and Lamar High School.
Ownership History
Date
Name
Owned For
Owner Type
Purchase Details
Closed on
Apr 28, 2023
Sold by
Swifty Buys Houses Llc
Bought by
Petro Property Llc
Current Estimated Value
Purchase Details
Closed on
Apr 14, 2023
Sold by
Schube Marilyn L
Bought by
Swifty Buys Houses Llc
Purchase Details
Closed on
Mar 26, 2009
Sold by
Hill Linda Donell
Bought by
Hill Linda Donell and Morales Rodolfo
Home Financials for this Owner
Home Financials are based on the most recent Mortgage that was taken out on this home.
Original Mortgage
$120,000
Interest Rate
5.14%
Mortgage Type
Credit Line Revolving
Purchase Details
Closed on
Apr 28, 2004
Sold by
Hill Leslie Calvin
Bought by
Hill Linda Donell
Purchase Details
Closed on
Dec 21, 1995
Sold by
Lyons George D and Lyons Julia
Bought by
Hill Linda Donell
Home Financials for this Owner
Home Financials are based on the most recent Mortgage that was taken out on this home.
Original Mortgage
$100,000
Interest Rate
7.33%
Create a Home Valuation Report for This Property
The Home Valuation Report is an in-depth analysis detailing your home's value as well as a comparison with similar homes in the area
Home Values in the Area
Average Home Value in this Area
Purchase History
| Date | Buyer | Sale Price | Title Company |
|---|---|---|---|
| Petro Property Llc | -- | Texas Title | |
| Swifty Buys Houses Llc | -- | Texas Title | |
| Hill Linda Donell | -- | Texas American Title Company | |
| Hill Linda Donell | -- | -- | |
| Hill Linda Donell | -- | American Title Co |
Source: Public Records
Mortgage History
| Date | Status | Borrower | Loan Amount |
|---|---|---|---|
| Previous Owner | Hill Linda Donell | $120,000 | |
| Previous Owner | Hill Linda Donell | $100,000 |
Source: Public Records
Tax History Compared to Growth
Tax History
| Year | Tax Paid | Tax Assessment Tax Assessment Total Assessment is a certain percentage of the fair market value that is determined by local assessors to be the total taxable value of land and additions on the property. | Land | Improvement |
|---|---|---|---|---|
| 2025 | $7,763 | $750,000 | $412,500 | $337,500 |
| 2024 | $7,763 | $655,729 | $378,125 | $277,604 |
| 2023 | $7,763 | $690,601 | $378,125 | $312,476 |
| 2022 | $8,579 | $689,000 | $275,000 | $414,000 |
| 2021 | $13,278 | $569,693 | $275,000 | $294,693 |
| 2020 | $13,812 | $583,202 | $262,500 | $320,702 |
| 2019 | $13,121 | $518,515 | $262,500 | $256,015 |
| 2018 | $8,841 | $504,943 | $246,094 | $258,849 |
| 2017 | $13,399 | $504,943 | $246,094 | $258,849 |
| 2016 | $14,289 | $538,500 | $213,281 | $325,219 |
| 2015 | $7,712 | $604,000 | $213,281 | $390,719 |
| 2014 | $7,712 | $300,000 | $180,469 | $119,531 |
Source: Public Records
Map
Nearby Homes
- 1638 W Alabama St
- 1612 W Alabama St Unit ABCD
- 1634 Marshall St
- 3705 Mandell St Unit 8
- 1531 Marshall St Unit 3
- 1615 W Main St
- 1723 Marshall St
- 1512 W Alabama St
- 1612 Kipling St
- 1648 Colquitt St
- 1660 Kipling St
- 1737 Branard St
- 1510 Marshall St
- 1517 Kipling St
- 1511 Kipling St
- 1507 Kipling St
- 1620 Harold St
- 1620, 1624 & 1630 Richmond Ave
- 1648 Richmond Ave
- 1721 Colquitt St
- 1637 Sul Ross St
- 1635 Sul Ross St
- 1638 Branard St
- 1636 Branard St
- 1623 Sul Ross St
- 1634 Branard St
- 1634 Branard St Unit 1/2
- 1634 Branard St
- 1640 Sul Ross St
- 1628 Branard St
- 1636 Sul Ross St
- 1621 Sul Ross St
- 3833 Dunlavy St Unit 809
- 3833 Dunlavy St Unit 711
- 3833 Dunlavy St Unit 426
- 3833 Dunlavy St Unit 120
- 3833 Dunlavy St Unit 319
- 3833 Dunlavy St Unit 345
- 3833 Dunlavy St Unit 311
- 3833 Dunlavy St Unit 450