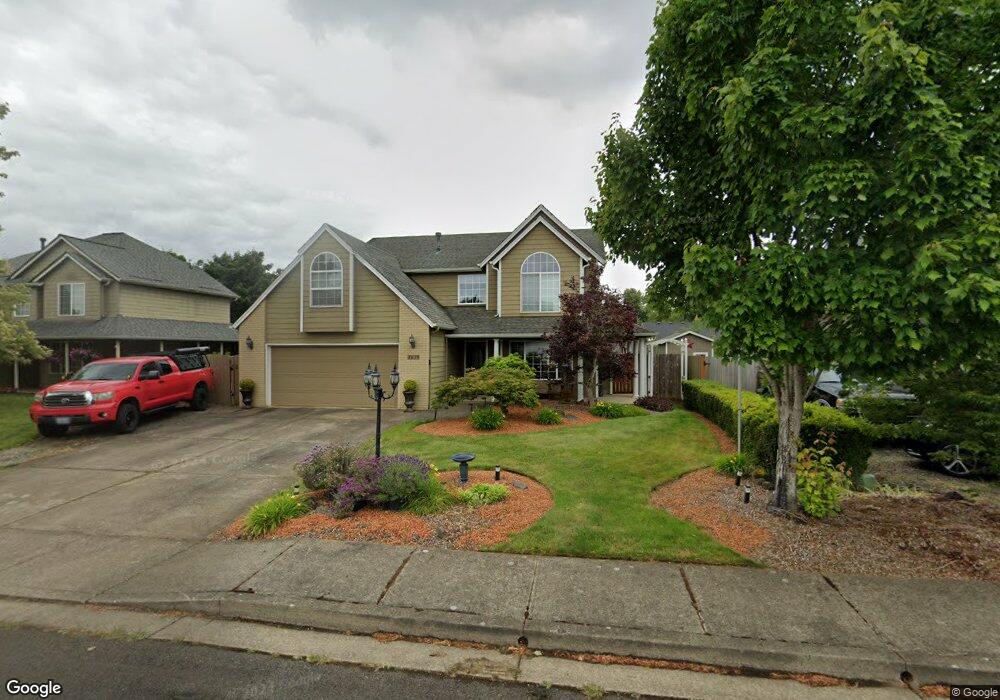
1639 SW Filbert Ln Dallas, OR 97338
Estimated Value: $536,000 - $563,000
4
Beds
3
Baths
2,078
Sq Ft
$262/Sq Ft
Est. Value
About This Home
This home is located at 1639 SW Filbert Ln, Dallas, OR 97338 and is currently estimated at $543,635, approximately $261 per square foot. 1639 SW Filbert Ln is a home located in Polk County with nearby schools including Lyle Elementary School, Whitworth Elementary School, and LaCreole Middle School.
Ownership History
Date
Name
Owned For
Owner Type
Purchase Details
Closed on
Oct 18, 2016
Sold by
Olsen Fink Julie M
Bought by
Fink Gerald A
Current Estimated Value
Home Financials for this Owner
Home Financials are based on the most recent Mortgage that was taken out on this home.
Original Mortgage
$299,570
Outstanding Balance
$240,009
Interest Rate
3.44%
Mortgage Type
VA
Estimated Equity
$303,626
Purchase Details
Closed on
Aug 17, 2006
Sold by
Fink Joleen M
Bought by
Fink Gerald A and Olsen Fink Julie M
Home Financials for this Owner
Home Financials are based on the most recent Mortgage that was taken out on this home.
Original Mortgage
$268,450
Interest Rate
6.76%
Mortgage Type
VA
Purchase Details
Closed on
Aug 29, 2005
Sold by
Fink William E
Bought by
Fink Joleen M
Home Financials for this Owner
Home Financials are based on the most recent Mortgage that was taken out on this home.
Original Mortgage
$188,000
Interest Rate
5.61%
Mortgage Type
Stand Alone First
Create a Home Valuation Report for This Property
The Home Valuation Report is an in-depth analysis detailing your home's value as well as a comparison with similar homes in the area
Home Values in the Area
Average Home Value in this Area
Purchase History
| Date | Buyer | Sale Price | Title Company |
|---|---|---|---|
| Fink Gerald A | -- | First American Title | |
| Fink Gerald A | $270,000 | First American Title | |
| Fink Joleen M | $40,000 | Lawyers Title Ins |
Source: Public Records
Mortgage History
| Date | Status | Borrower | Loan Amount |
|---|---|---|---|
| Open | Fink Gerald A | $299,570 | |
| Closed | Fink Gerald A | $268,450 | |
| Previous Owner | Fink Joleen M | $188,000 |
Source: Public Records
Tax History Compared to Growth
Tax History
| Year | Tax Paid | Tax Assessment Tax Assessment Total Assessment is a certain percentage of the fair market value that is determined by local assessors to be the total taxable value of land and additions on the property. | Land | Improvement |
|---|---|---|---|---|
| 2025 | $3,759 | $274,450 | $71,000 | $203,450 |
| 2024 | $3,759 | $266,460 | $68,940 | $197,520 |
| 2023 | $3,615 | $258,700 | $66,930 | $191,770 |
| 2022 | $3,520 | $251,170 | $64,980 | $186,190 |
| 2021 | $3,423 | $243,860 | $63,090 | $180,770 |
| 2020 | $3,325 | $236,760 | $61,250 | $175,510 |
| 2019 | $3,229 | $229,870 | $59,460 | $170,410 |
| 2018 | $3,220 | $223,180 | $57,730 | $165,450 |
| 2017 | $3,094 | $216,680 | $56,050 | $160,630 |
| 2016 | $3,113 | $210,370 | $54,420 | $155,950 |
| 2015 | $3,058 | $204,250 | $52,830 | $151,420 |
| 2014 | $2,934 | $198,310 | $51,290 | $147,020 |
Source: Public Records
Map
Nearby Homes
- 1673 SW Sagebrush Ct
- 278 SW Applegate Trail Dr
- 494 SW Oregon Falls Dr
- 498 SW Oregon Falls Dr
- 493 SW Oregon Falls Dr
- 481 SW Oregon Falls Dr
- 374 SW Applegate Trail Dr
- 1401 W Ellendale (#49) Ave Unit 49
- 1401 W Ellendale (#54) Ave Unit 54
- 1401 W Ellendale Ave
- 1401 W Ellendale Ave Unit 9
- 1401 W Ellendale Ave Unit 78 Av
- 155 NW Beaver Ct
- 511 SW Augustus Dr
- 307 SW Bell Dr
- 481 NW Crater Lake Dr
- 493 NW Crater Lake Dr
- Lot 120 NW Crater Lake Dr
- Lot B NW Crater Lake Dr
- 275 James Howe Rd
- 1633 SW Filbert Ln
- 1655 SW Filbert Ln
- 1644 SW Pecan Ct
- 1656 SW Pecan Ct
- 1621 SW Filbert Ln
- 1669 SW Filbert Ln
- 299 SW Oregon Trail Dr
- 1634 SW Pecan Ct
- 1642 SW Filbert Ln
- 1632 SW Filbert Ln
- 1652 SW Filbert Ln
- 309 SW Oregon Trail Dr
- 1620 SW Filbert Ln
- 490 SW Oregon Trail Dr
- 440 SW Oregon Trail Dr
- 319 SW Oregon Trail Dr
- 1668 SW Filbert Ln
- 1675 SW Filbert Ln
- 1635 SW Pecan Ct
- 1672 SW Filbert Ln