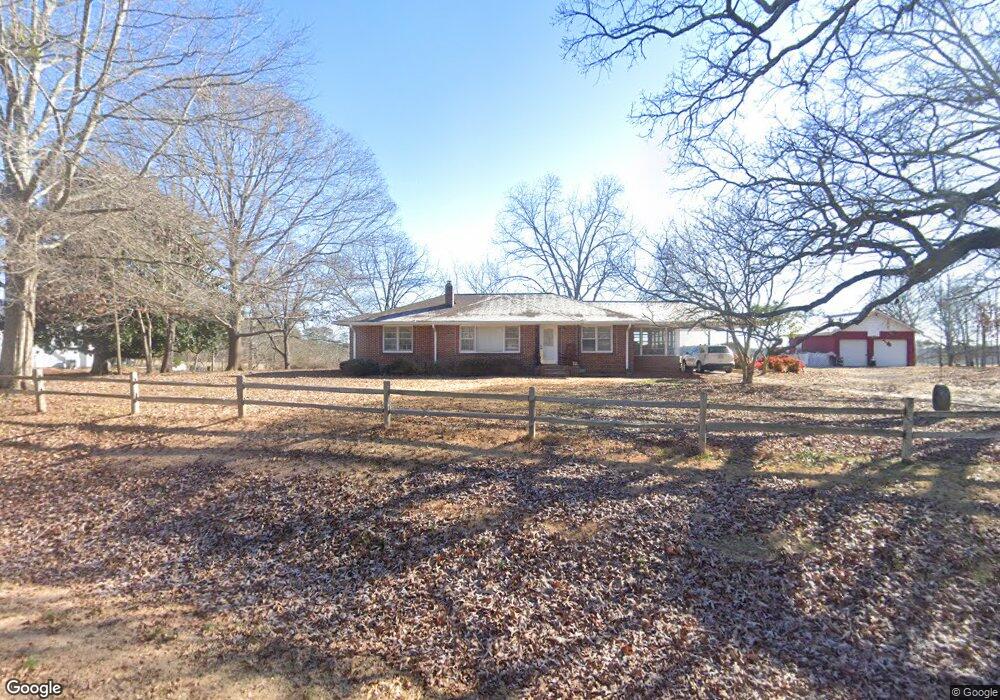
1639 Taylors Gin Rd Temple, GA 30179
Estimated Value: $238,000 - $254,565
3
Beds
1
Bath
1,517
Sq Ft
$162/Sq Ft
Est. Value
About This Home
This home is located at 1639 Taylors Gin Rd, Temple, GA 30179 and is currently estimated at $245,891, approximately $162 per square foot. 1639 Taylors Gin Rd is a home located in Carroll County with nearby schools including Providence Elementary School, Temple Middle School, and Temple High School.
Ownership History
Date
Name
Owned For
Owner Type
Purchase Details
Closed on
Mar 28, 2011
Sold by
Secretary Of Hud
Bought by
Gerald Densil Burns Trust
Current Estimated Value
Purchase Details
Closed on
Jun 1, 2010
Sold by
Bac Home Loans Servicing L
Bought by
Secretary Dept Of Housing
Purchase Details
Closed on
Jul 27, 2007
Sold by
Not Provided
Bought by
Bac Home Loans Servicing Lp
Home Financials for this Owner
Home Financials are based on the most recent Mortgage that was taken out on this home.
Original Mortgage
$118,146
Interest Rate
6.63%
Mortgage Type
FHA
Purchase Details
Closed on
May 4, 1996
Sold by
Odom
Bought by
Boynton Boynton J and Boynton Traci
Purchase Details
Closed on
Oct 2, 1995
Sold by
Taylor Clara
Bought by
Boynton Boynton J and Boynton Traci
Purchase Details
Closed on
Jan 1, 1951
Sold by
Steadham W L
Bought by
Taylor C W
Create a Home Valuation Report for This Property
The Home Valuation Report is an in-depth analysis detailing your home's value as well as a comparison with similar homes in the area
Home Values in the Area
Average Home Value in this Area
Purchase History
| Date | Buyer | Sale Price | Title Company |
|---|---|---|---|
| Gerald Densil Burns Trust | $60,100 | -- | |
| Secretary Dept Of Housing | -- | -- | |
| Bac Home Loans Servicing Lp | $141,476 | -- | |
| Bac Home Loans Servicing Lp | $120,000 | -- | |
| Boynton Boynton J | -- | -- | |
| Boynton Boynton J | $50,000 | -- | |
| Taylor C W | -- | -- |
Source: Public Records
Mortgage History
| Date | Status | Borrower | Loan Amount |
|---|---|---|---|
| Previous Owner | Bac Home Loans Servicing Lp | $118,146 |
Source: Public Records
Tax History Compared to Growth
Tax History
| Year | Tax Paid | Tax Assessment Tax Assessment Total Assessment is a certain percentage of the fair market value that is determined by local assessors to be the total taxable value of land and additions on the property. | Land | Improvement |
|---|---|---|---|---|
| 2025 | $199 | $71,149 | $5,046 | $66,103 |
| 2024 | $201 | $71,149 | $5,046 | $66,103 |
| 2023 | $201 | $64,628 | $4,038 | $60,590 |
| 2022 | $239 | $51,341 | $2,692 | $48,649 |
| 2021 | $241 | $44,484 | $2,153 | $42,331 |
| 2020 | $242 | $39,522 | $1,958 | $37,564 |
| 2019 | $224 | $36,478 | $1,958 | $34,520 |
| 2018 | $212 | $33,664 | $1,958 | $31,706 |
| 2017 | $214 | $33,664 | $1,958 | $31,706 |
| 2016 | $214 | $33,664 | $1,958 | $31,706 |
| 2015 | $266 | $39,588 | $4,417 | $35,172 |
| 2014 | $268 | $39,589 | $4,417 | $35,172 |
Source: Public Records
Map
Nearby Homes
- 100 Gordons Lake Dr
- 223 Sunlight Cove
- 155 Garrison Ct
- 0 Old Draketown Trail 5 62 Acres Unit 293 148093
- 139 Clover Ct
- 125 Governor Ln
- 0 Old Draketown Trail Unit 10580748
- 118 Raven Rd
- 116 Edna Ct
- 2505 Rockmart Rd
- 1401 Rainey Rd
- 40 Holder Rd
- 256 Astin Creek Rd
- 150 Charles Painter Rd
- 319 Wesley Mill Ct
- 2607 Highway 101 S
- 108 Ann Place
- 489 Bethany Woods Dr
- 1694 Hannah Rd
- 1021 Cown Rd
- 0 Tumlin Lake Rd Unit 10019641
- 0 Tumlin Lake Rd Unit 10019635
- 0 Tumlin Lake Rd Unit 10141941
- 0 Tumlin Lake Rd Unit 7192064
- 0 Tumlin Lake Rd Unit 8741457
- 0 Tumlin Lake Rd Unit 8615507
- 11 Tumlin Lake Rd
- 1665 Taylors Gin Rd
- 247 Sunlight Cove
- 251 Sunlight Cove
- 243 Sunlight Cove
- 255 Sunlight Cove
- 239 Sunlight Cove
- 259 Sunlight Cove
- 254 Sunlight Cove
- 246 Sunlight Cove
- 250 Sunlight Cove
- 300 Majestic Run
- 301 Majestic Run
- 262 Sunlight Cove