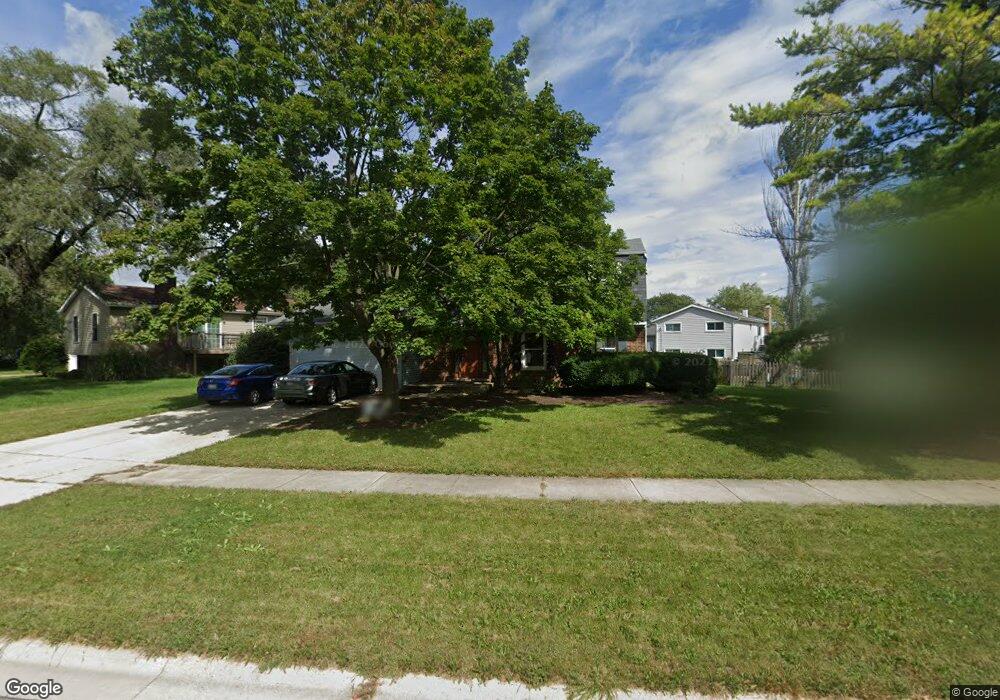
1639 Wadham Place Wheaton, IL 60189
North Danada NeighborhoodEstimated Value: $452,560 - $593,000
4
Beds
3
Baths
2,062
Sq Ft
$249/Sq Ft
Est. Value
About This Home
This home is located at 1639 Wadham Place, Wheaton, IL 60189 and is currently estimated at $514,390, approximately $249 per square foot. 1639 Wadham Place is a home located in DuPage County with nearby schools including Briar Glen Elementary School, Glen Crest Middle School, and Glenbard South High School.
Ownership History
Date
Name
Owned For
Owner Type
Purchase Details
Closed on
Sep 16, 2024
Sold by
Vogt Ulreh J
Bought by
Wasserman Katherine N
Current Estimated Value
Home Financials for this Owner
Home Financials are based on the most recent Mortgage that was taken out on this home.
Original Mortgage
$304,700
Outstanding Balance
$301,676
Interest Rate
7.12%
Mortgage Type
New Conventional
Estimated Equity
$212,714
Purchase Details
Closed on
Jul 9, 2019
Sold by
Vogt Ulreh J and Wasserman Katherine N
Bought by
Vogt Ulreh J and Wasserman Katherine N
Purchase Details
Closed on
May 23, 2002
Sold by
Petrusa John T and Houte Terre L
Bought by
Vogt Ulreh J and Wasserman Katherine N
Home Financials for this Owner
Home Financials are based on the most recent Mortgage that was taken out on this home.
Original Mortgage
$201,600
Interest Rate
7%
Create a Home Valuation Report for This Property
The Home Valuation Report is an in-depth analysis detailing your home's value as well as a comparison with similar homes in the area
Home Values in the Area
Average Home Value in this Area
Purchase History
| Date | Buyer | Sale Price | Title Company |
|---|---|---|---|
| Wasserman Katherine N | -- | Pro Title Group | |
| Vogt Ulreh J | -- | Attorney | |
| Vogt Ulreh J | $252,000 | Burnet Title Llc |
Source: Public Records
Mortgage History
| Date | Status | Borrower | Loan Amount |
|---|---|---|---|
| Open | Wasserman Katherine N | $304,700 | |
| Previous Owner | Vogt Ulreh J | $201,600 |
Source: Public Records
Tax History
| Year | Tax Paid | Tax Assessment Tax Assessment Total Assessment is a certain percentage of the fair market value that is determined by local assessors to be the total taxable value of land and additions on the property. | Land | Improvement |
|---|---|---|---|---|
| 2024 | $9,438 | $132,932 | $35,493 | $97,439 |
| 2023 | $9,007 | $122,360 | $32,670 | $89,690 |
| 2022 | $8,633 | $115,630 | $30,870 | $84,760 |
| 2021 | $8,491 | $112,890 | $30,140 | $82,750 |
| 2020 | $8,718 | $111,840 | $29,860 | $81,980 |
| 2019 | $8,491 | $108,890 | $29,070 | $79,820 |
| 2018 | $8,982 | $113,540 | $27,400 | $86,140 |
| 2017 | $8,360 | $109,350 | $26,390 | $82,960 |
| 2016 | $8,234 | $104,990 | $25,340 | $79,650 |
| 2015 | $8,171 | $100,160 | $24,170 | $75,990 |
| 2014 | $7,669 | $93,010 | $25,310 | $67,700 |
| 2013 | $7,437 | $93,290 | $25,390 | $67,900 |
Source: Public Records
Map
Nearby Homes
- 1678 Groton Ct
- 1129 Rhodes Ct
- 1581 Groton Ln
- 953 Cordova Ct
- 1720 Lakecliffe Dr Unit A
- 1601 Castbourne Ct
- 840 Sheldon Ct Unit B
- 570 Riva Ct
- 429 Sandhurst Cir Unit 1
- 1216 E Elm St
- 23W160 Woodcroft Dr
- 448 Raintree Ct Unit 1C
- 1000 S Lorraine Rd Unit 214
- 440 Raintree Ct Unit 1G
- 478 Raintree Ct Unit 2B
- 450 Raintree Ct Unit 2M
- 450 Raintree Ct Unit 2B
- 453 Raintree Dr Unit 5A
- 453 Raintree Dr Unit 1H
- 1265 Windsor Dr
- 1633 Wadham Place
- 1628 Briarcliffe Blvd
- 1622 Briarcliffe Blvd
- 1634 Briarcliffe Blvd
- 1627 Wadham Place
- 1636 Wadham Place
- 1630 Wadham Ct
- 1640 Wadham Place
- 1616 Briarcliffe Blvd
- 1634 Wadham Place
- 1621 Wadham Place
- 1642 Wadham Place
- 1616 Wadham Ct
- 1628 Wadham Ct
- 1644 Briarcliffe Blvd
- 1582 Briarcliffe Blvd
- 1615 Wadham Place
- 1615 Briarcliffe Blvd Unit 4
- 1621 Briarcliffe Blvd
- 1612 Wadham Place
Your Personal Tour Guide
Ask me questions while you tour the home.