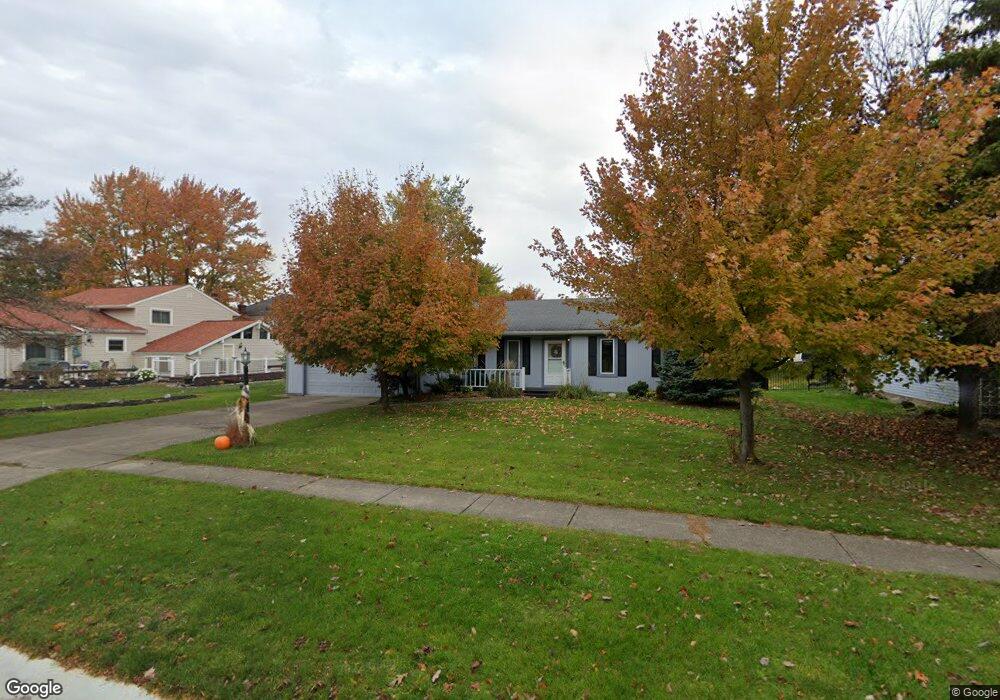
16398 Lakeforest Dr Strongsville, OH 44136
Estimated Value: $321,000 - $361,000
3
Beds
2
Baths
1,810
Sq Ft
$185/Sq Ft
Est. Value
About This Home
This home is located at 16398 Lakeforest Dr, Strongsville, OH 44136 and is currently estimated at $335,027, approximately $185 per square foot. 16398 Lakeforest Dr is a home located in Cuyahoga County with nearby schools including Strongsville High School, Sts Joseph & John Interparochial School, and The Academy of St. Bartholomew.
Ownership History
Date
Name
Owned For
Owner Type
Purchase Details
Closed on
May 30, 2003
Sold by
Macmillan James and Macmillan Christine D
Bought by
Roswurm Dean H and Roswurm Susan L
Current Estimated Value
Home Financials for this Owner
Home Financials are based on the most recent Mortgage that was taken out on this home.
Original Mortgage
$55,000
Interest Rate
5.9%
Mortgage Type
Purchase Money Mortgage
Purchase Details
Closed on
May 3, 1994
Sold by
Madonia Frank P
Bought by
Macmillan James G
Purchase Details
Closed on
May 14, 1990
Sold by
Madonia Frank P
Bought by
Madonia Frank P
Purchase Details
Closed on
Sep 21, 1983
Bought by
Madonia Frank P
Purchase Details
Closed on
Apr 12, 1982
Bought by
Continental Fedl S & L Asso
Purchase Details
Closed on
Dec 21, 1981
Bought by
Mays A R - Trustee
Purchase Details
Closed on
Jan 1, 1979
Bought by
New Concord Homes Inc
Create a Home Valuation Report for This Property
The Home Valuation Report is an in-depth analysis detailing your home's value as well as a comparison with similar homes in the area
Home Values in the Area
Average Home Value in this Area
Purchase History
| Date | Buyer | Sale Price | Title Company |
|---|---|---|---|
| Roswurm Dean H | $186,700 | Chicago Title | |
| Macmillan James G | $144,900 | -- | |
| Madonia Frank P | -- | -- | |
| Madonia Frank P | $79,200 | -- | |
| Partridge Housing Corp | -- | -- | |
| Continental Fedl S & L Asso | -- | -- | |
| Mays A R - Trustee | -- | -- | |
| New Concord Homes Inc | -- | -- |
Source: Public Records
Mortgage History
| Date | Status | Borrower | Loan Amount |
|---|---|---|---|
| Closed | Roswurm Dean H | $55,000 |
Source: Public Records
Tax History Compared to Growth
Tax History
| Year | Tax Paid | Tax Assessment Tax Assessment Total Assessment is a certain percentage of the fair market value that is determined by local assessors to be the total taxable value of land and additions on the property. | Land | Improvement |
|---|---|---|---|---|
| 2024 | $4,579 | $107,310 | $24,325 | $82,985 |
| 2023 | $4,502 | $81,070 | $21,390 | $59,680 |
| 2022 | $4,495 | $231,600 | $61,100 | $170,500 |
| 2021 | $4,460 | $81,060 | $21,390 | $59,680 |
| 2020 | $4,263 | $69,900 | $18,450 | $51,450 |
| 2019 | $4,138 | $199,700 | $52,700 | $147,000 |
| 2018 | $3,755 | $69,900 | $18,450 | $51,450 |
| 2017 | $3,623 | $63,360 | $14,040 | $49,320 |
| 2016 | $3,593 | $63,360 | $14,040 | $49,320 |
| 2015 | $3,520 | $63,360 | $14,040 | $49,320 |
| 2014 | $3,520 | $61,500 | $13,620 | $47,880 |
Source: Public Records
Map
Nearby Homes
- 9286 Rainier Ct
- 9945 Twelve Oaks Cir
- 9129 Tahoe Cir
- 10369 Council Bluff
- 10560 Stapleton Dr
- 9890 Webster Rd
- 10010 Chevy Chase
- 16519 Albion Rd
- 15485 Albion Rd
- 18203 Broxton Dr
- 18433 Whitney Rd
- 0 Webster Rd
- 9531 Nicole Cir
- 18737 Evergreen Dr
- 11650 River Moss Rd
- 14069 Basswood Cir
- 12101 The Bluffs
- Buchanan Plan at The Enclave at Pine Lakes Crossing
- Belleville Plan at The Enclave at Pine Lakes Crossing
- 7685 Saratoga Rd
- 16366 Lakeforest Dr
- 9419 Huntington Park Dr
- 9387 Huntington Park Dr
- 16375 Commons Oval
- 16334 Lakeforest Dr
- 9355 Huntington Park Dr
- 16385 Commons Oval
- 16385 Lakeforest Dr
- 9487 Huntington Park Dr
- 16353 Lakeforest Dr
- 16395 Commons Oval
- 16302 Lakeforest Dr
- 16465 Commons Oval
- 16321 Lakeforest Dr
- 16475 Commons Oval
- 16270 Commons Oval
- 9511 Huntington Park Dr
- 16280 Commons Oval
- 16270 Lakeforest Dr
- 16289 Lakeforest Dr