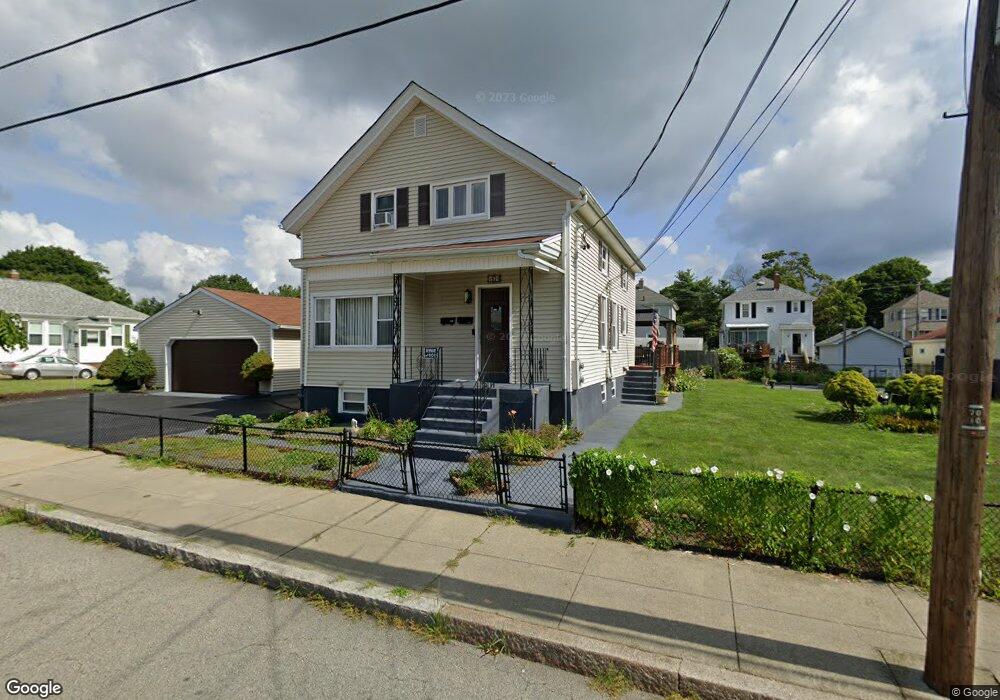
164 Anthony St Fall River, MA 02721
Maplewood NeighborhoodEstimated Value: $426,856 - $593,000
5
Beds
2
Baths
1,478
Sq Ft
$323/Sq Ft
Est. Value
About This Home
This home is located at 164 Anthony St, Fall River, MA 02721 and is currently estimated at $477,464, approximately $323 per square foot. 164 Anthony St is a home located in Bristol County with nearby schools including Letourneau Elementary School, Matthew J. Kuss Middle School, and B M C Durfee High School.
Ownership History
Date
Name
Owned For
Owner Type
Purchase Details
Closed on
Aug 28, 2015
Sold by
Nunes Mary
Bought by
164 Anthony Street Irt and Nunes
Current Estimated Value
Purchase Details
Closed on
Aug 31, 1987
Sold by
Silva Jose F
Bought by
Nunes Abel
Create a Home Valuation Report for This Property
The Home Valuation Report is an in-depth analysis detailing your home's value as well as a comparison with similar homes in the area
Home Values in the Area
Average Home Value in this Area
Purchase History
| Date | Buyer | Sale Price | Title Company |
|---|---|---|---|
| 164 Anthony Street Irt | -- | -- | |
| 164 Anthony Street Irt | -- | -- | |
| Nunes Abel | $80,000 | -- |
Source: Public Records
Mortgage History
| Date | Status | Borrower | Loan Amount |
|---|---|---|---|
| Previous Owner | Nunes Abel | $132,000 | |
| Previous Owner | Nunes Abel | $140,000 | |
| Previous Owner | Nunes Abel | $40,000 | |
| Closed | Nunes Abel | $0 |
Source: Public Records
Tax History
| Year | Tax Paid | Tax Assessment Tax Assessment Total Assessment is a certain percentage of the fair market value that is determined by local assessors to be the total taxable value of land and additions on the property. | Land | Improvement |
|---|---|---|---|---|
| 2025 | $4,358 | $380,600 | $132,800 | $247,800 |
| 2024 | $4,018 | $349,700 | $127,800 | $221,900 |
| 2023 | $3,658 | $298,100 | $109,600 | $188,500 |
| 2022 | $3,372 | $267,200 | $99,600 | $167,600 |
| 2021 | $3,163 | $228,700 | $92,200 | $136,500 |
| 2020 | $2,880 | $199,300 | $88,200 | $111,100 |
| 2019 | $2,729 | $187,200 | $84,000 | $103,200 |
| 2018 | $2,551 | $174,500 | $82,400 | $92,100 |
| 2017 | $2,404 | $171,700 | $84,100 | $87,600 |
| 2016 | $2,362 | $173,300 | $87,600 | $85,700 |
| 2015 | $2,225 | $170,100 | $84,400 | $85,700 |
| 2014 | $2,278 | $181,100 | $88,800 | $92,300 |
Source: Public Records
Map
Nearby Homes
Your Personal Tour Guide
Ask me questions while you tour the home.