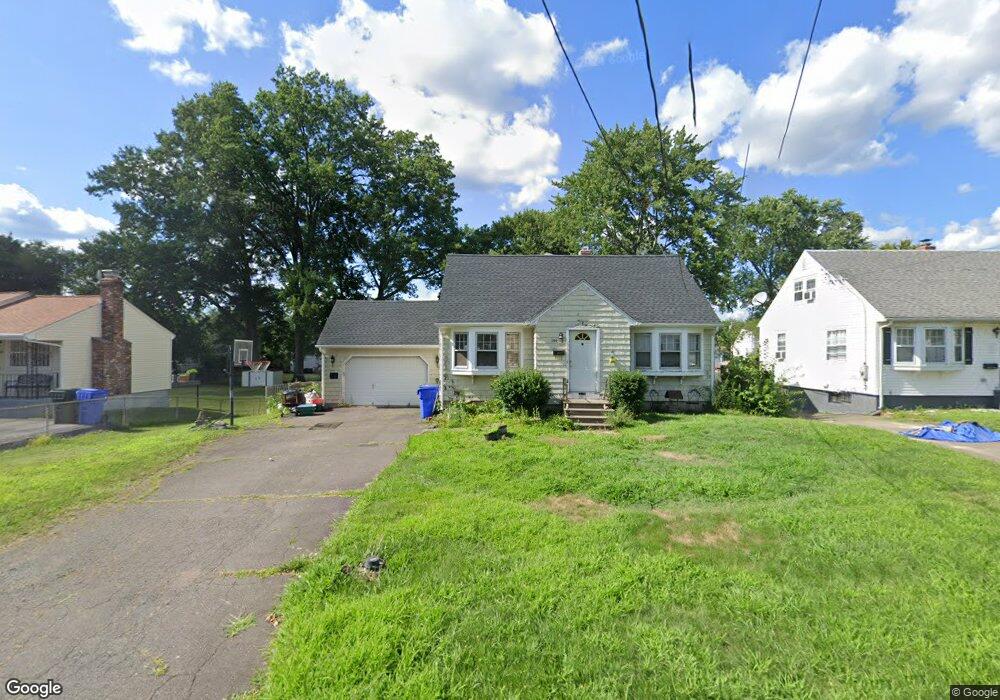
164 Camp Ave Newington, CT 06111
Estimated Value: $365,000 - $400,000
3
Beds
3
Baths
1,717
Sq Ft
$223/Sq Ft
Est. Value
About This Home
This home is located at 164 Camp Ave, Newington, CT 06111 and is currently estimated at $382,982, approximately $223 per square foot. 164 Camp Ave is a home located in Hartford County with nearby schools including Anna Reynolds School, Martin Kellogg Middle School, and Newington High School.
Ownership History
Date
Name
Owned For
Owner Type
Purchase Details
Closed on
Jun 22, 2021
Sold by
Smith Donna M Est and Dorsey
Bought by
Dorsey Laura
Current Estimated Value
Home Financials for this Owner
Home Financials are based on the most recent Mortgage that was taken out on this home.
Original Mortgage
$35,372
Interest Rate
2.7%
Mortgage Type
Stand Alone Refi Refinance Of Original Loan
Purchase Details
Closed on
Aug 21, 2006
Sold by
Winski Kevin A
Bought by
Smith Donna M
Home Financials for this Owner
Home Financials are based on the most recent Mortgage that was taken out on this home.
Original Mortgage
$135,000
Interest Rate
6.88%
Purchase Details
Closed on
Jul 30, 2002
Sold by
Keyes Carol L
Bought by
Winski Kevin A and Winski Maria L
Create a Home Valuation Report for This Property
The Home Valuation Report is an in-depth analysis detailing your home's value as well as a comparison with similar homes in the area
Home Values in the Area
Average Home Value in this Area
Purchase History
| Date | Buyer | Sale Price | Title Company |
|---|---|---|---|
| Dorsey Laura | -- | None Available | |
| Dorsey Laura | -- | None Available | |
| Smith Donna M | $251,900 | -- | |
| Winski Kevin A | $219,000 | -- | |
| Smith Donna M | $251,900 | -- | |
| Winski Kevin A | $219,000 | -- |
Source: Public Records
Mortgage History
| Date | Status | Borrower | Loan Amount |
|---|---|---|---|
| Previous Owner | Dorsey Laura | $35,372 | |
| Previous Owner | Winski Kevin A | $135,000 |
Source: Public Records
Tax History Compared to Growth
Tax History
| Year | Tax Paid | Tax Assessment Tax Assessment Total Assessment is a certain percentage of the fair market value that is determined by local assessors to be the total taxable value of land and additions on the property. | Land | Improvement |
|---|---|---|---|---|
| 2025 | $6,087 | $152,240 | $56,560 | $95,680 |
| 2024 | $6,039 | $152,240 | $56,560 | $95,680 |
| 2023 | $5,840 | $152,240 | $56,560 | $95,680 |
| 2022 | $5,860 | $152,240 | $56,560 | $95,680 |
| 2021 | $5,908 | $152,240 | $56,560 | $95,680 |
| 2020 | $5,626 | $143,240 | $53,030 | $90,210 |
| 2019 | $5,651 | $143,240 | $53,030 | $90,210 |
| 2018 | $5,515 | $143,240 | $53,030 | $90,210 |
| 2017 | $5,241 | $143,240 | $53,030 | $90,210 |
| 2016 | $5,121 | $143,240 | $53,030 | $90,210 |
| 2014 | $4,855 | $139,640 | $52,970 | $86,670 |
Source: Public Records
Map
Nearby Homes
- 140 Camp Ave
- 35 Harding Ave
- 27 Harding Ave
- 105 Gilbert Rd
- 31 Dacosta Dr
- 47 Francis Dr
- 20 Surrey Dr Unit B16 aka B4
- 131 Williamstown Ct Unit 131
- 305 Hampton Ct
- 263 Williamstown Ct
- 29 Sunnyside Rd
- 37 Commonwealth Ave
- 84 Connecticut Ave
- 57 Welles Dr
- 16 Thornton Dr
- 559 Mountain Rd
- 228 Reservoir Rd
- 236 Sterling Dr Unit 236
- 218 Sterling Dr Unit 218
- 9 Old Farm Dr