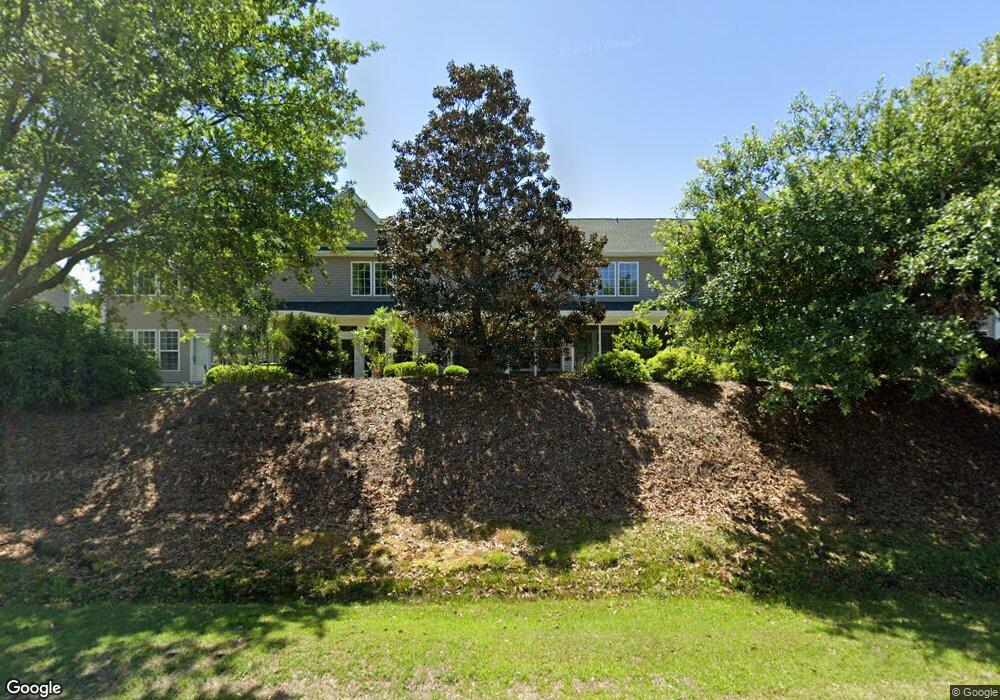
164 Chenoa Dr Unit 29B Murrells Inlet, SC 29576
Burgess NeighborhoodEstimated Value: $210,000 - $215,559
2
Beds
3
Baths
996
Sq Ft
$214/Sq Ft
Est. Value
About This Home
This home is located at 164 Chenoa Dr Unit 29B, Murrells Inlet, SC 29576 and is currently estimated at $213,186, approximately $214 per square foot. 164 Chenoa Dr Unit 29B is a home located in Horry County with nearby schools including St. James Elementary School, St. James Middle School, and St. James Intermediate.
Create a Home Valuation Report for This Property
The Home Valuation Report is an in-depth analysis detailing your home's value as well as a comparison with similar homes in the area
Home Values in the Area
Average Home Value in this Area
Tax History Compared to Growth
Tax History
| Year | Tax Paid | Tax Assessment Tax Assessment Total Assessment is a certain percentage of the fair market value that is determined by local assessors to be the total taxable value of land and additions on the property. | Land | Improvement |
|---|---|---|---|---|
| 2024 | $934 | $8,600 | $0 | $8,600 |
| 2023 | $2,764 | $12,611 | $0 | $12,611 |
| 2021 | $586 | $12,611 | $0 | $12,611 |
| 2020 | $1,253 | $12,611 | $0 | $12,611 |
| 2019 | $1,253 | $12,611 | $0 | $12,611 |
| 2018 | $0 | $9,261 | $0 | $9,261 |
| 2017 | $1,117 | $5,292 | $0 | $5,292 |
| 2016 | -- | $5,292 | $0 | $5,292 |
| 2015 | $1,117 | $9,261 | $0 | $9,261 |
| 2014 | $1,057 | $5,292 | $0 | $5,292 |
Source: Public Records
Map
Nearby Homes
- 160 Chenoa Dr Unit A
- 136 Parmelee Dr Unit C
- 155 Chenoa Dr Unit D
- 135 Parmelee Dr Unit C
- 140 Parmelee Dr Unit A
- 624 Indigo Bunting Ln Unit C
- 139 Chenoa Dr Unit D
- 301 Nut Hatch Ln Unit D
- 122 Parmelee Dr Unit a
- 122 Parmelee Dr Unit E
- 149 Parmelee Dr Unit E
- 153b Parmelee Dr Unit B
- 9883 Merry Ln
- 119 Chenoa Dr Unit 4D
- 751 Painted Bunting Dr Unit E
- 153 Wimbledon Way
- 9889 Merry Ln
- 168 Wimbledon Way
- 171 Parmelee Dr Unit D
- 9533 Sullivan Dr
- 164 Chenoa Dr Unit Park West, Unit E
- 164 Chenoa Dr
- 164 Chenoa Dr Unit 29F
- 164 Chenoa Dr Unit 29D
- 164 Chenoa Dr Unit 29C
- 164 Chenoa Dr Unit 29A
- 164 Chenoa Dr Unit E
- 164 Chenoa Dr Unit B
- 164 Chenoa Dr Unit C
- 164 Chenoa Dr Unit B
- 163 Chenoa Dr Unit E Park West
- 163 Chenoa Dr Unit 163 Chenoa Drive
- 163 Chenoa Dr Unit D
- 163 Chenoa Dr Unit Park West
- 163 Chenoa Dr Unit Park West F
- 163 Chenoa Dr
- 163 Chenoa Dr Unit 38F
- 163 Chenoa Dr Unit 38B
- 163 Chenoa Dr Unit 38A
- 163 Chenoa Dr Unit F